by Calculated Risk on 7/23/2011 10:58:00 AM
Saturday, July 23, 2011
Summary for Week Ending July 22nd
The big story of the week was in Europe: Greece will default. Here is the statement: STATEMENT BY THE HEADS OF STATE OR GOVERNMENT OF THE EURO AREA AND EU INSTITUTIONS
This marks a significant step in the European financial crisis. The European leaders have finally recognized that the Greek debt burden must be reduced. Analysts are debating if this debt reduction is sufficient - probably not - and if other countries will need to default too. European leaders are adamant that private sector involvement is for Greece only. I have my doubts.
The U.S. data was mixed. There was a little good news in the housing sector including an increase in multifamily starts and in the remodeling index. Existing home sales were weak as expected, and the Architecture Billings Index (for commercial real estate) indicated contraction.
In manufacturing, the Philly Fed survey indicated a little expansion in July, from contraction in June.
Finally, the debt ceiling charade continued. As expected, no deficit reduction deal was reached, and we have now arrived at the final act. My guess is a deal will be reached to raise the debt ceiling, there will be a filibuster in the Senate, the House might reject the deal once, and then it will finally pass.
• Housing Starts increased in June
From the Census Bureau: Permits, Starts and Completions
Housing Starts:
Privately-owned housing starts in June were at a seasonally adjusted annual rate of 629,000. This is 14.6 percent (±10 9%) above the revised May estimate of 549,000 and is 16.7 percent (±11.8%) above the June 2010 rate of 539,000.
Single-family housing starts in June were at a rate of 453,000; this is 9.4 percent (±11.1%)* above the revised May figure of 414,000. The June rate for units in buildings with five units or more was 170,000.
 Click on graph for larger image in graph gallery.
Total housing starts were at 629 thousand (SAAR) in June, up 14.6% from the revised May rate of 549 thousand.
Single-family starts increased 9.4% to 453 thousand in June.
The second graph shows total and single unit starts since 1968.
 This shows the huge collapse following the housing bubble, and that housing starts have mostly been moving sideways for over two years - with slight ups and downs due to the home buyer tax credit.
This was above expectations of 575 thousand starts in June. Multi-family starts are increasing in 2011 - although from a very low level. This is one of the bright spots for construction and the economy this year.
• Existing Home Sales in June: 4.77 million SAAR, 9.5 months of supply
 The NAR reports: June Existing-Home Sales Slip on Contract Cancellations
This graph shows existing home sales, on a Seasonally Adjusted Annual Rate (SAAR) basis since 1993.
Sales in June 2011 (4.77 million SAAR) were 0.8% lower than last month, and were 8.8% lower than in June 2010.
According to the NAR, inventory increased to 3.77 million in June from 3.65 million in May.
 This graph shows the year-over-year (YoY) change in reported existing home inventory and months-of-supply. Since inventory is not seasonally adjusted, so it really helps to look at the YoY change. Note: Months-of-supply is based on the seasonally adjusted sales and not seasonally adjusted inventory.
Inventory decreased 3.1% year-over-year in June from June 2010. This is the fifth consecutive month with a YoY decrease in inventory.
Months of supply increased to 9.5 months in June, up from 9.1 months in May. These sales numbers were below the consensus, but close to Lawler's forecast was 4.71 million using the NAR method.
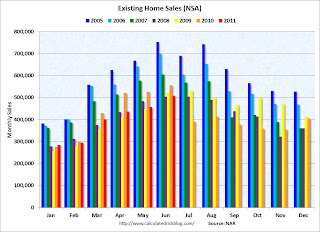
 This graph shows existing home sales Not Seasonally Adjusted (NSA).
The red columns are for 2011.
Sales NSA are below the tax credit boosted level of sales in June 2010 and June 2009, but slightly above the level of June sales in 2008.
Last year sales collapsed in July (orange column - after the expiration of the tax credit), so expect a report of a large YoY increase in sales announced next month.
• AIA: Architecture Billings Index indicates declining demand in June
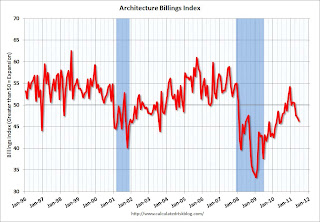
Note: This index is a leading indicator for new Commercial Real Estate (CRE) investment.
 This graph shows the Architecture Billings Index since 1996. The index decreased in June to 46.3 from 47.2 in May. Anything below 50 indicates a contraction in demand for architects' services.
Note: Nonresidential construction includes commercial and industrial facilities like hotels and office buildings, as well as schools, hospitals and other institutions. Note that the government sector is the weakest. The American Recovery and Reinvestment Act of 2009 is winding down, and state and local governments are still cutting back.
According to the AIA, there is an "approximate nine to twelve month lag time between architecture billings and construction spending" on non-residential construction. So this suggests another dip in CRE investment in 2012.
• Residential Remodeling Index at new high in May
 The BuildFax Residential Remodeling Index was at 124.3 in May, up from 109.7 in April. This is based on the number of properties pulling residential construction permits in a given month.
 This is the highest level for the index (started in 2004) - even above the levels from 2004 through 2006 during the home equity ("home ATM") withdrawal boom.
Note: permits are not adjusted by value, so this doesn't mean there is more money being spent, just more permit activity. Also some smaller remodeling projects are done without permits and the index will miss that activity.
 Since there is a strong seasonal pattern for remodeling, the second graph shows the year-over-year change from the same month of the previous year.
The remodeling index is up 22% from May 2010.
Even though new home construction is still moving sideways, it appears that two other components of residential investment will increase in 2011: multi-family construction and home improvement.
Data Source: BuildFax, Courtesy of Index.BuildFax.com
• Moody's: Commercial Real Estate Prices increased in May
 From Bloomberg: U.S. Commercial Property Prices Increased 6.3% in May, Moody’s Says
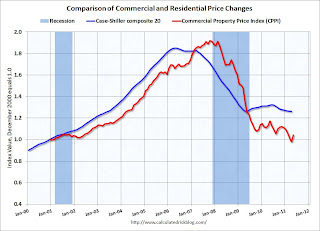
Here is a comparison of the Moodys/REAL Commercial Property Price Index (CPPI) and the Case-Shiller composite 20 index. CRE prices only go back to December 2000. The Case-Shiller Composite 20 residential index is in blue (with Dec 2000 set to 1.0 to line up the indexes).
According to Moody's, CRE prices are down 11% from a year ago and down about 46% from the peak in 2007. Prices fell sharply over the previous six months, and this increase only erases part of that decline.
Note: There are few commercial real estate transactions compared to residential, so this index is very volatile.
• Philly Fed Survey: "Regional manufacturing remained weak in July"
 From the Philly Fed: July 2011 Business Outlook Survey "The survey’s broadest measure of manufacturing conditions, the diffusion index of current activity, increased to 3.2 from -7.7 [any reading above zero is expansion]."
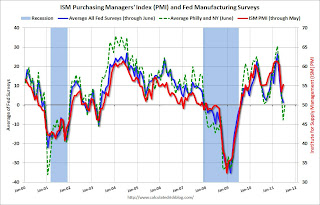
Here is a graph comparing the regional Fed surveys and the ISM manufacturing index. The dashed green line is an average of the NY Fed (Empire State) and Philly Fed surveys through July. The ISM and total Fed surveys are through June.
The averaged Empire State and Philly Fed surveys are back close to zero combined. July was a little better than June for both surveys.
• Other Economic Stories ...
• NAHB Builder Confidence index increases in July, Still Depressed
• On Track for Record Low Housing Completions in 2011
• Multi-family Starts and Completions
• NY Fed's Brian Sack: The SOMA Portfolio at $2.654 Trillion
Have a great weekend!


