by Calculated Risk on 7/09/2011 08:21:00 AM
Saturday, July 09, 2011
Summary for Week Ending July 8th
The key story of the week was the June employment report - and the report was dismal.
There were only 18,000 total payroll jobs added in June, and 57,000 private sector payroll jobs. Also the BLS revised down April and May payrolls showing 44,000 fewer jobs were added than previously reported.
Basically every number was ugly: The unemployment rate increased from 9.1% to 9.2%, and the participation rate declined to 64.1%. The employment population ratio fell to 58.2%, matching the lowest level during the current employment recession. U-6, an alternate measure of labor underutilization that includes part time workers and marginally attached workers, increased to 16.2%, the highest level this year.
The average workweek declined slightly to 34.3 hours, and average hourly earnings ticked down.
As I noted yesterday, the only good news was that June is over.
Europe was also in the news, with more discussions about Greece, and bond yields rising sharply for Portugal, Ireland and even Italy. The results of the European bank stress tests will be released this coming Friday, and the European financial crisis will remain headline news.
Finally Reis released their Q2 office, mall and apartment vacancy rates. Apartment vacancy rates are declining, office vacancy rates are moving sideways, and mall vacancy rates are still increasing.
There wasn't much data last week, but it sure finished ugly.
Below is a summary of economic data last week mostly in graphs:
• June Employment Report: 18,000 Jobs, 9.2% Unemployment Rate
 Click on graph for larger image in graph gallery.
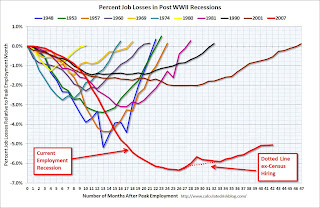
This graph shows the job losses from the start of the employment recession, in percentage terms aligned at the start of the recession.
In this post, the graph showed the job losses aligned at maximum job losses.
In terms of percentage payroll jobs, the 2007 recession is by far the worst since WWII.
 This graph shows the employment population ratio, the participation rate, and the unemployment rate. The unemployment rate increased to 9.2% (red line).
The Labor Force Participation Rate declined to 64.1% in June (blue line). This is the percentage of the working age population in the labor force. This is the lowest level since the early '80s when
The Employment-Population ratio declined to 58.2% in June (black line). This ties the lowest level during the recession.
 The number of workers only able to find part time jobs (or have had their hours cut for economic reasons) increased slightly to 8.552 million in June.
These workers are included in the alternate measure of labor underutilization (U-6) that increased to 16.2% in June from 15.8% in May. This is the highest level this year (highest since December 2010).
The next graph shows the duration of unemployment as a percent of the civilian labor force.
 The graph shows the number of unemployed in four categories: less than 5 week, 6 to 14 weeks, 15 to 26 weeks, and 27 weeks or more.
Two key categories are moving up again. The 27 weeks and more (the long term unemployed) has moved up for two consecutive months and is now at 6.3 million workers, or 4.1% of the labor force.
Also, the 'less than 5 weeks' category is increasing again and that indicates recent weakness in the labor market.
Here are the employment posts from yesterday:
1) June Employment Report: 18,000 Jobs, 9.2% Unemployment Rate
2) Employment Summary, Part Time Workers, and Unemployed over 26 Weeks
3) Return of the Teen! and Unemployment by Duration and Education
4) Employment graph gallery
• ISM Non-Manufacturing Index indicates slower expansion in June
From the Institute for Supply Management: June 2011 Non-Manufacturing ISM Report On Business®
 The June ISM Non-manufacturing index was at 53.3%, down from 54.6% in May. The employment index increased in June to 54.1%, up from 54.0% in May. Note: Above 50 indicates expansion, below 50 contraction.
This graph shows the ISM non-manufacturing index (started in January 2008) and the ISM non-manufacturing employment diffusion index.
This was below the consensus forecast of 54.0%.
• Reis: Office, Mall and Apartment Vacancy Reports
Reis reported the Q2 office, mall and apartment vacancy rates. Apartment vacancy rates are declining, office vacancy rates are moving sideways, and mall vacancy rates are still increasing.
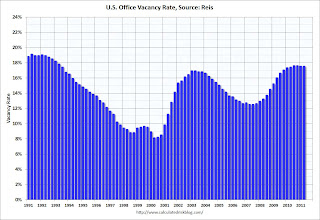
 This graph shows the office vacancy rate starting in 1991.
Reis reported the office vacancy rate was at 17.5% in Q2 2011, the same rate as in Q1, and up from 17.4% in Q2 2010. It appears the office vacancy rate might have peaked - and is now moving sideways. It will be a good sign when the vacancy rate starts falling.
From Reuters: Sluggish economy slows US office market rebound
 Reis reported that the apartment vacancy rate (82 markets) fell to 6.0% in Q2 from 6.2% in Q1. The vacancy rate was at 7.8% in Q2 2010 and peaked at 8.0% at the end of 2009.
From the WSJ: Rents Rise, Vacancies Go Down
This graph shows the apartment vacancy rate starting in 2005.
Reis is just for large cities, but this decline in vacancy rates is happening just about everywhere.
 From Reuters: US mall vacancies rise in 2nd quarter, rents flat
"Preliminary figures by real estate research firm Reis show the vacancy rate at ... regional malls rose to 9.3 percent ... up from 9.1 percent in the first quarter. ... The vacancy rate at these local retail strips was 11 percent versus 10.9 percent in the first quarter, almost matching the 11.1 percent record set 20 years ago"
• Other Economic Stories ...
• From the American Bankruptcy Institute: Consumer Bankruptcy Filings Down 8 Percent Through the First Half of 2011
• From National Federation of Independent Business (NFIB): NFIB Jobs Statement: June is a Bust, but July Looks Hopeful
• ADP: Private Employment increased by 157,000 in June
Have a great weekend!


