by Calculated Risk on 8/16/2011 03:24:00 PM
Tuesday, August 16, 2011
Lawler: Early Read on Existing Home Sales in July
From economist Tom Lawler (this is an update to the short note yesterday):
While national existing home sales last month were clearly up from last July’s post-tax-credit cycle low (on a seasonally adjusted basis), it appears as if national closed sales last month did not rebound on a seasonally adjusted basis from June’s level – despite the increase in May and June pending sales. Indeed, based on my regional tracking (though I’m missing a lot of areas), and taking into account the lower business-day count this July than last July (which lower [the July 2011] seasonal factor relative to [July 2010]), I estimate that US existing home sales as measured by the National Association of Realtors may have actually declined slightly on a seasonally adjusted basis in July from June. This surprises me, given the rebound in pending sales in May and June. However, in quite a few areas of the country closed sales fell considerably short of what one would have expected given contract signings over the previous several months, either reflecting increased cancellations or closing delays. And in other areas, including some Florida markets, continued delays in the foreclosure process resulting in sizable declines in foreclosure sales.
To be sure, for areas with associations/MLS that have reported July stats, the degree to which sales last month rebounded from last July’s really low levels has varied massively, even for areas relatively close to one another (and some areas saw no rebound at all).
Just to remind folks, here are the NAR’s estimates of existing home sales (SF plus condo/coop) on both an unadjusted and a seasonally adjusted basis ...
 Click on graph for larger image in graph gallery.
Note: CR graphs added.
Last July existing home sales on a seasonally adjusted basis plunged by 26.2% from June’s pace, and were down 25.2% from July 2009’s pace. Unadjusted sales were down 26.5% from July 2009.
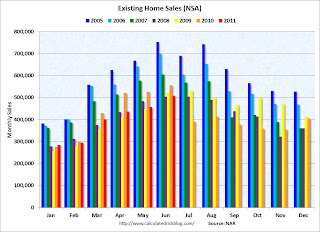
[The following graph shows existing home sales Not Seasonally Adjusted (NSA).]
 If existing home sales this July were to be flat on a seasonally adjusted basis to [June], they would have to be up 23.6% from last July’s pace. Given the calendar/lower business day count this July vs. [July 2010], I estimate that unadjusted sales this July would have to be up by around 20% from a year ago, and my regional tracking just doesn’t get that large an increase.
To be sure, there are many areas with YOY gains well above 20%, especially in the Midwest (where sales declined the sharpest last July). However, there are several large markets were this July’s sales were either little changed from last July (including the whole state of California and Northern Virginia) or even down from a year ago (including several Florida markets), and several more with only modest YOY gains (including Maryland, DC, South Carolina, Charlotte, Vegas, Long Island, and Albuquerque). Taken all the information I’ve seen so far, my “best” estimate (with a larger than normal forecast error) is that existing home sales (as measured by the NAR) ran at a SAAR of about 4.69 million in July, down 1.7% from June’s pace.
CR: This was from Tom Lawler. The NAR reported existing home sales at 4.77 million in June, and the consensus (from Bloomberg) is for sales of 4.92 million at a Seasonally Adjusted Annual Rate (SAAR) in July (the NAR will report on Thursday - take the under!).


