by Calculated Risk on 9/09/2011 02:25:00 PM
Friday, September 09, 2011
AAR: Rail Traffic mixed in August
The Association of American Railroads (AAR) reports carload traffic in Auguest 2011 decreased 0.3 percent compared with the same month last year, and intermodal traffic (using intermodal or shipping containers) increased 0.4 percent compared with August 2010. On a seasonally adjusted basis, carloads in August 2011 were flat compared to July 2011; intermodal in August 2011 was up 0.3% from July 2011.
On a non-seasonally adjusted basis, total U.S. freight rail carloads were down 0.3% in August 2011 from August 2010. Railroads originated 1,482,570 carloads in August 2011, down from 1,486,378 in August 2010. ... As the chart [below] shows, for the past five months rail carload traffic has been joined at the hip with the same month in 2010.
 Click on graph for larger image in graph gallery.
This graph shows U.S. average weekly rail carloads (NSA).
Rail carload traffic collapsed in November 2008, and now, over 2 years into the recovery, carload traffic is only about half way back.
"Excluding coal, U.S. rail carloads in August 2011 were up 1.0% over August 2010. Excluding coal and grain, U.S. rail carloads in August 2011 were up 3.7% over August 2010"
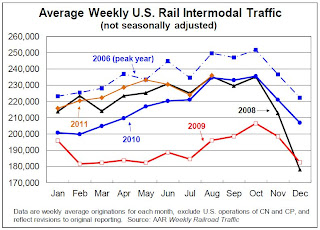
 The second graph is for intermodal traffic (using intermodal or shipping containers):
Intermodal continued its upward march in August. U.S. railroads originated 1,179,838 trailers and containers in August 2011, an average of 235,968 units per week. That’s the highest weekly average for any month since October 2007. Less impressive is the fact that August 2011 was up just 0.4% (4,196 units) over August 2010.August was another soft month for rail traffic.
excerpts with permission


