by Calculated Risk on 10/22/2011 02:15:00 PM
Saturday, October 22, 2011
Schedule for Week of Oct 23rd
Earlier:
• Summary for Week ending Oct 21st
This is a key week for Europe, starting with the European leaders summit meeting on Sunday.
The key U.S. economic report for the coming week is the Q3 advance GDP report to be released on Thursday. There are also two important housing reports to be released early in the week: Case-Shiller house prices on Tuesday and New Home sales on Wednesday.
Several high frequency releases will be closely watched: weekly initial unemployment claims, consumer sentiment (final) and two more regional Fed manufacturing surveys.
European Union leaders will hold a summit meeting.
8:30 AM ET: Chicago Fed National Activity Index (September). This is a composite index of other data.
8:45 AM: New York Fed President William Dudley speaks on "Regional and National Economic Outlook" at Fordham University Gabelli School of Business. Following the recent speeches by Fed Vice Chairman Janet Yellen and Fed Governor Daniel Tarullo, discussing the possibility of more Fed MBS purchases, this speech by Dudley will be closely watched.
Expected: The Moody's/REAL Commercial Property Price Index (commercial real estate price index) for August.
 9:00 AM: S&P/Case-Shiller House Price Index for August. Although this is the August report, it is really a 3 month average of June, July and August.
 This graph shows the nominal seasonally adjusted Composite 10 and Composite 20 indices (the Composite 20 was started in January 2000).
The consensus is for prices to increase 0.2% in August. The CoreLogic index showed a 0.8% decrease in August (NSA). Based on the other price indexes, the Case-Shiller index could show a decrease in August.
10:00 AM: Conference Board's consumer confidence index for October. The consensus is for an increase to 46.0 from 45.4 last month.
10:00 AM: Richmond Fed Survey of Manufacturing Activity for October. The consensus is for the index to be at -1, up from -6 in September (below zero is contraction).
10:00 AM: FHFA House Price Index for August 2011. This is based on GSE repeat sales and is no longer as closely followed as Case-Shiller (or CoreLogic).
7:00 AM: The Mortgage Bankers Association (MBA) will release the mortgage purchase applications index. This index has been especially weak since early August, although this doesn't include cash buyers.
8:30 AM: Durable Goods Orders for September from the Census Bureau. The consensus is for a 0.9% decrease in durable goods orders after decreasing 0.1% in August.
 10:00 AM: New Home Sales for September from the Census Bureau.
 This graph shows New Home Sales since 1963. The dashed line is the current sales rate.
The consensus is for a slight increase in sales to 300 thousand Seasonally Adjusted Annual Rate (SAAR) in September from 295 thousand in August.
8:30 AM: The initial weekly unemployment claims report will be released. The consensus is for a slight increase to 405,000 from 403,000 last week. The 4-week average is still above 400,000, however the average has declined recently to the lowest level since early April.
 8:30 AM: Q2 GDP (advance release). This is the advance release from the BEA. The consensus is that real GDP increased 2.5% annualized in Q3.
This graph shows the quarterly GDP growth (at an annual rate) for the last 30 years.
The blue column is the forecast for Q3 GDP.
10:00 AM: Pending Home Sales Index for September. The consensus is for a 0.1% increase in the index.
11:00 AM: Kansas City Fed regional Manufacturing Survey for October. The consensus is for an increase to 8 in October from 6 in September (slight expansion).
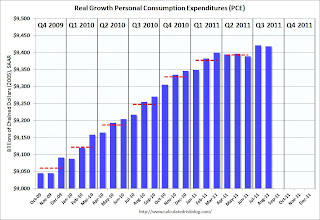
 8:30 AM: Personal Income and Outlays for September. The following graph shows real Personal Consumption Expenditures (PCE) through June (2005 dollars).
 PCE increased 0.2 in August, and real PCE decreased slightly as the price index for PCE increased 0.2 percent in August.
The consensus is for a 0.3% increase in personal income in August, and a 0.6% increase in personal spending, and for the Core PCE price index to increase 0.2%.
9:55 AM: Reuter's/University of Michigan's Consumer sentiment index (final for October). The consensus is for a slight increase to 58.0 from the preliminary reading of 57.5.


