by Calculated Risk on 11/21/2011 10:00:00 AM
Monday, November 21, 2011
Existing Home Sales in October: 4.97 million SAAR, 8.0 months of supply
The NAR reports: October Existing-Home Sales Rise, Unsold Inventory Continues to Decline
Total existing-home sales, which are completed transactions that include single-family, townhomes, condominiums and co-ops, rose 1.4 percent to a seasonally adjusted annual rate of 4.97 million in October from a downwardly revised 4.90 million in September, and are 13.5 percent above the 4.38 million unit level in October 2010.
...
Total housing inventory at the end of October fell 2.2 percent to 3.33 million existing homes available for sale, which represents an 8.0-month supply at the current sales pace, down from an 8.3-month supply in September. Inventories have been trending gradually down since setting a record of 4.58 million in July 2008.
 Click on graph for larger image in graph gallery.
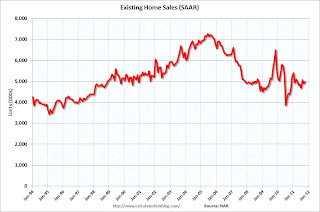
This graph shows existing home sales, on a Seasonally Adjusted Annual Rate (SAAR) basis since 1993.
Sales in October 2011 (4.97 million SAAR) were 1.4% higher than last month, and were 13.5% above the October 2010 rate.
 The second graph shows nationwide inventory for existing homes.
According to the NAR, inventory decreased to 3.33 million in October from 3.41 million in September.
The last graph shows the year-over-year (YoY) change in reported existing home inventory and months-of-supply. Since inventory is not seasonally adjusted, it really helps to look at the YoY change. Note: Months-of-supply is based on the seasonally adjusted sales and not seasonally adjusted inventory.
 Inventory decreased 13.8% year-over-year in October from October 2010. This is the ninth consecutive month with a YoY decrease in inventory.
Months of supply decreased to 8.0 months in October, down from 8.3 months in September. This is still higher than normal. These sales numbers were just above the consensus.


