by Calculated Risk on 11/17/2011 06:22:00 PM
Thursday, November 17, 2011
Multi-family Starts and Completions, and Quarterly Starts by Intent
Since it usually takes over a year on average to complete multi-family projects - and multi-family starts were at a record low last year - it makes sense that there will be a record low, or near record low, number of multi-family completions this year.
The following graph shows the lag between multi-family starts and completions using a 12 month rolling total.
The blue line is for multifamily starts and the red line is for multifamily completions. Since multifamily starts collapsed in 2009, completions collapsed in 2010.
 Click on graph for larger image.
The rolling 12 month total for starts (blue line) has been increasing all year. It now appears multi-family starts will be in the 150 thousand to 160 thousand unit range in 2011, up from 104 thousand units in 2010. That is a 50%+ increase in starts - but from a very low level.
Completions (red line) appear to have bottomed. This is probably because builders are rushing projects to completion because of the strong demand for rental units.
It is important to emphasize that even with a strong increase in multi-family construction, it is 1) from a very low level, and 2) multi-family is a small part of residential investment (RI). But this is bright spot for construction.
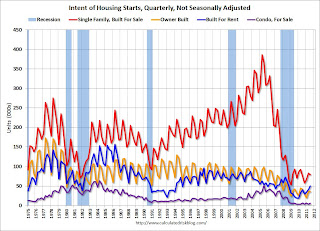
Also today, the Census Bureau released the "Quarterly Starts and Completions by Purpose and Design" report for Q3 2011. Although this data is Not Seasonally Adjusted (NSA), it shows the trends for several key housing categories.
 This graph shows the NSA quarterly intent for four start categories since 1975: single family built for sale, owner built (includes contractor built for owner), starts built for rent, and condos built for sale.
Single family starts built for sale were up slightly year-over-year in Q3. This was the 2nd weakest Q3 on record. Owner built starts were at a record low for a Q3, and condos built for sale are scrapping along the bottom.
Only the 'units built for rent' is showing any significant pickup. This is a 25% increase from Q3 2010 and more than double Q3 2009.
The largest category - starts of single family units, built for sale - has mostly been moving sideways at very depressed level for about 3 years.
Earlier:
• Weekly Initial Unemployment Claims: Four Week average falls under 400,000
• MBA: Mortgage Delinquencies decline slightly in Q3
• Q3 MBA National Delinquency Survey: Comments and State Data
• Philly Fed: "Regional manufacturing is expanding, but at a slow pace"
• Housing Starts decline slightly in October


