by Calculated Risk on 11/28/2011 01:37:00 PM
Monday, November 28, 2011
New Home Prices: Average Lowest since 2003
As part of the new home sales report, the Census Bureau reported that the average price for new homes fell to the lowest level since September 2003.
From the Census Bureau: "The median sales price of new houses sold in October 2011 was $212,300; the average sales price was $242,300."
The following graph shows the median and average new home prices. The average new home price is at the lowest level since August 2003.
 Click on graph for larger image.
This makes sense - to compete with all the distressed sales, the builders have had to build smaller and less expensive homes.
The second graph shows the percent of new home sales by price. At the peak of the housing bubble, almost 40% of new homes were sold for more than $300K - and over 20% were sold for over $400K. In October, only 20% were sold for more than $300K - and only 8% for over $400K.
 Almost half of all home sales in October were under $200K - and about 80% of home sales were under $300K. This is the lowest percentage under $300K since November 2002.
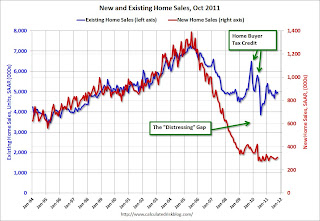
The third graph shows existing home sales (left axis) and new home sales (right axis) through October.
This graph starts in 1994, but the relationship has been fairly steady back to the '60s. Then along came the housing bubble and bust, and the "distressing gap" appeared due mostly to distressed sales.
 The flood of distressed sales has kept existing home sales elevated, and depressed new home sales since builders can't compete with the low prices of all the foreclosed properties.
I expect this gap to close over the next few years once the number of distressed sales starts to decline.
Note: The National Association of Realtors (NAR) is working on a benchmark revision for existing home sales numbers and I expect significant downward revisions to sales estimates for the last few years - perhaps as much as 10% to 15% for 2011. Even with these revisions, most of the "distressing gap" will remain.
Earlier:
• New Home Sales in October: 307,000 SAAR
• All current New Home Graphs


