by Calculated Risk on 1/10/2012 04:54:00 PM
Tuesday, January 10, 2012
Fiscal Policy: Kind of a Drag
Cardiff Garcia at the Financial Times Alphaville has posted a new graph from economist Alec Phillips of Goldman Sachs: Fiscal flailing, continued
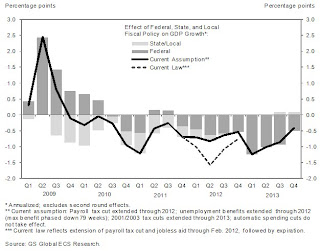
CR note: The following graph shows the estimated impact of Federal, state and local policy on GDP growth. The dark shaded rectangles are Federal policy and the light shaded rectangles are state and local policy. From Garcia:
Goldman Sachs has updated this chart, which shows the projected impact of fiscal policy on GDP growth, to reflect its latest assumptions (see the previous version here):
The dotted line that dips through 2012 is what would happen if, um, nothing happens — that is, no new fiscal measures are passed in 2012. The bars and the black line are Goldman’s forecast.
 Click on graph for larger image.
 Goldman’s assumptions include the payroll tax cut’s extension through the end of the year. Emergency unemployment benefits will also probably be extended, but the analysts expect that the maximum duration will be reduced from 99 weeks to 79 weeks.There is more discussion in Garcia's post.
A couple of key points:
1) In addition to the assumptions about 2012, this estimate assumes that the "2001/2003 tax cuts are extended through 2013, and that automatic spending cuts do not take effect." That isn't clear at this point, and the fiscal drag in 2013 could be significantly more than shown on the graph.
2) The good news, according to this estimate from Phillips, is that the drag from state and local governments will stop mid-year 2012, and be neutral for the following 12 months. That fits with my current outlook for State and Local Governments.


