by Calculated Risk on 2/04/2012 08:09:00 AM
Saturday, February 04, 2012
Summary for Week ending February 3rd
The data released last week was solid, with the exception of house prices. Both the Case-Shiller index for November, and the CoreLogic index for December showed additional house price declines and new post bubble lows.
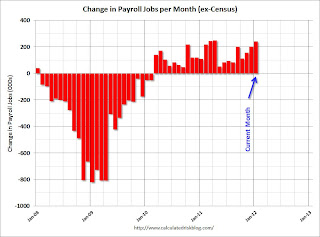
The employment report was well above expectations. There were 243,000 payroll jobs added in January, with 257,000 private sector jobs added. Government employment declined by 14,000 jobs. The unemployment rate fell to 8.3% from 8.5% in December. U-6, an alternate measure of labor underutilization that includes part time workers and marginally attached workers, declined to 15.1%. This remains very high - U-6 was in the 8% range in 2007.
The annual benchmark revision indicated 165,000 more payroll jobs in March 2011; the first positive benchmark revision since 2006. The BLS also adjusted the population control using the Census 2010 data, and this led to some data distortions – but overall the report was positive.
Unfortunately there are still 12.8 million Americans unemployed, and 5.5 million who have been unemployed for more than 6 months. Those are very grim unemployment numbers.
Other positive data included auto sales, and the ISM manufacturing and service indexes. Also the apartment tightness index indicated that rental markets continued to tighten (good for multifamily construction and spillover to the single family market). Overall a solid week.
Here is a summary in graphs:
• January Employment Report: 243,000 Jobs, 8.3% Unemployment Rate
This graph shows the jobs added or lost per month (excluding temporary Census jobs) since the beginning of 2008.
 Click on graph for larger image.
Job growth started picking up early last year, but then the economy was hit by a series of shocks (oil price increase, tsunami in Japan, debt ceiling debate) - and now it appears job growth is picking up again.
The second graph shows the employment population ratio, the participation rate, and the unemployment rate.
 The unemployment rate declined to 8.3% (red line).
The Labor Force Participation Rate declined to 63.7% in January (blue line). However the decline was related to the change in population control, and not people leaving the work force.
The Employment-Population ratio was unchanged at 58.5% in January (black line). This would have increased 0.3 with the change in population control.
 The third graph shows the job losses from the start of the employment recession, in percentage terms. The dotted line is ex-Census hiring.
This shows the depth of the recent employment recession - much worst than any other post-war recession - and the relatively slow recovery due to the lingering effects of the housing bust and financial crisis.
This was a relatively strong report and well above consensus expectations.
• ISM Manufacturing index indicates faster expansion in January
 PMI was at 54.1% in January, up from a revised 53.1% in December. The employment index was at 54.3%, down from a revised 54.8%, and new orders index was at 57.6%, up from a revised 54.8%.
 From the Institute for Supply Management: January 2012 Manufacturing ISM Report On Business® Here is a long term graph of the ISM manufacturing index.
This was below expectations of 54.5%, but the consensus was before the revisions. This suggests manufacturing expanded at a faster rate in January than in December. It appears manufacturing employment expanded in January with the employment index at 54.3%.
• U.S. Light Vehicle Sales at 14.18 million annual rate in January
 Based on an estimate from Autodata Corp, light vehicle sales were at a 14.18 million SAAR in January. That is up 12.1% from January 2011, and up 5.1% from the sales rate last month (13.5 million SAAR in Dec 2011).
The second graph shows light vehicle sales since the BEA started keeping data in 1967. This shows the huge collapse in sales in the 2007 recession. This also shows the impact of the tsunami and supply chain issues on sales, especially in May and June.
This was well above the consensus forecast of 13.6 million SAAR. Note: dashed line is current estimated sales rate.
• Case Shiller: House Prices fall to new post-bubble lows in November (seasonally adjusted)
From S&P: Home Prices Continued to Decline in November 2011 According to the S&P/Case-Shiller Home Price Indices
 This graph shows the nominal seasonally adjusted Composite 10 and Composite 20 indices (the Composite 20 was started in January 2000).
The Composite 10 index is off 33.5% from the peak, and down 0.7% in November (SA). The Composite 10 is at a new post bubble low (Seasonally adjusted), but still above the low NSA.
The Composite 20 index is off 33.5% from the peak, and down 0.7% in November (SA). The Composite 20 is also at a new post-bubble low.
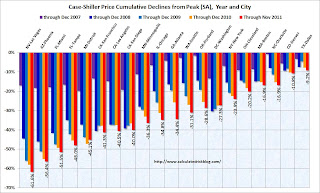
The next graph shows the price declines from the peak for each city included in S&P/Case-Shiller indices.
 Prices increased (SA) in 3 of the 20 Case-Shiller cities in November seasonally adjusted (only one city increased NSA). Prices in Las Vegas are off 61.6% from the peak, and prices in Dallas only off 9.2% from the peak.
The NSA indexes are around 1% above the March 2011 lows - and these indexes will hit new lows in the next month or two since prices are falling again. Using the SA data, the Case-Shiller indexes are now at new post-bubble lows.
• CoreLogic: House Price Index declined 1.4% in December to new post-bubble low
 From CoreLogic: CoreLogic® Prices fell by 4.7 percent nationally in 2011
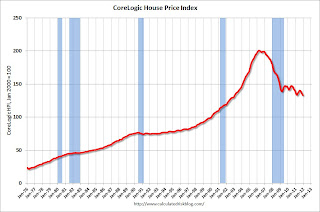
This graph shows the national CoreLogic HPI data since 1976. January 2000 = 100.
The index was down 1.4% in December, and is down 4.7% over the last year.
The index is off 33.7% from the peak - and is now at a new post-bubble low.
Some of this decline was seasonal (the CoreLogic index is NSA) and month-to-month price changes will probably remain negative through March 2012. Last year prices fell about 4% from December 2010 to March 2011, and there will probably be a similar decline this year.
• NMHC Apartment Survey: Market Conditions Tighten in Recent Survey
 From the National Multi Housing Council (NMHC): Apartment Industry Continues Recovery, Survey Says
This graph shows the quarterly Apartment Tightness Index. Any reading above 50 indicates tightening from the previous quarter. The index has indicated tighter market conditions for the last eight quarters and suggests falling vacancy rates and or rising rents.
This fits with the recent Reis data showing apartment vacancy rates fell in Q4 2011 to 5.2%, down from 5.6% in Q3 2011, and 9.0% at the end of 2009.
• ISM Non-Manufacturing Index indicates faster expansion in January
 The January ISM Non-manufacturing index was at 56.8%, up sharply from 53.0% in December. The employment index increased in January to 57.4%, up from 49.8% in December. Note: Above 50 indicates expansion, below 50 contraction.
 From the Institute for Supply Management: December 2011 Non-Manufacturing ISM Report On Business®
This graph shows the ISM non-manufacturing index (started in January 2008) and the ISM non-manufacturing employment diffusion index.
This was well above the consensus forecast of 53.3% and indicates faster expansion in January than in December.
• Weekly Initial Unemployment Claims decline to 367,000
 The dashed line on the graph is the current 4-week average. The four-week average of weekly unemployment claims decreased this week to 375,750.
Weekly claims have been bouncing around lately - January is a period with large seasonal adjustments and that can lead to some large swings. The 4-week average of weekly claims has been moving sideways this year after trending down over the last few months of 2011.
• Other Economic Stories ...
• Restaurant Performance Index highest in almost six years in December
• A few policies I expect soon
• Fed Senior Loan Officer Survey: Lending standards "little changed", "somewhat stronger loan demand"
• From the Dallas Fed: Texas Manufacturing Activity Picks Up
• Personal Income increased 0.5% in December, Spending decreased slightly
• Fannie Mae Serious Delinquency rate declines, Freddie Mac rate increases
• Q4 2011 GDP Details: Investment in Office, Mall, and Lodging, Residential Components


