by Calculated Risk on 3/01/2012 01:54:00 PM
Thursday, March 01, 2012
CoreLogic: 11.1 Million U.S. Properties with Negative Equity in Q4
CoreLogic released the Q4 2011 negative equity report today.
CoreLogic ... today released negative equity data showing that 11.1 million, or 22.8 percent, of all residential properties with a mortgage were in negative equity at the end of the fourth quarter of 2011. This is up from 10.7 million properties, 22.1 percent, in the third quarter of 2011. An additional 2.5 million borrowers had less than five percent equity, referred to as near-negative equity, in the fourth quarter. Together, negative equity and near-negative equity mortgages accounted for 27.8 percent of all residential properties with a mortgage nationwide in the fourth quarter, up from 27.1 in the previous quarter. Nationally, the total mortgage debt outstanding on properties in negative equity increased from $2.7 trillion in the third quarter to $2.8 trillion in the fourth quarter.Here are a couple of graphs from the report:
“Due to the seasonal declines in home prices and slowing foreclosure pipeline which is depressing home prices, the negative equity share rose in late 2011. The negative equity share is back to the same level as Q3 2009, which is when we began reporting negative equity using this methodology. The high level of negative equity and the inability to pay is the ‘double trigger’ of default, and the reason we have such a significant foreclosure pipeline. While the economic recovery will reduce the propensity of the inability to pay trigger, negative equity will take an extended period of time to improve, and if there is a hiccup in the economic recovery, it could mean a rise in foreclosures.” said Mark Fleming, chief economist with CoreLogic.
 Click on graph for larger image.
This graph shows the break down of negative equity by state. Note: Data not available for some states. From CoreLogic:
"Nevada had the highest negative equity percentage with 61 percent of all of its mortgaged properties underwater, followed by Arizona (48 percent), Florida (44 percent), Michigan (35 percent) and Georgia (33 percent). This is the second consecutive quarter that Georgia was in the top five, surpassing California (29 percent) which previously had been in the top five since tracking began in 2009. The top five states combined have an average negative equity share of 44.3 percent, while the remaining states have a combined average negative equity share of 15.3 percent."
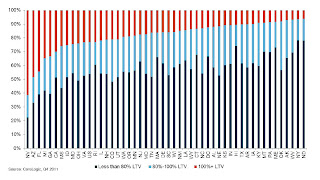
 The second graph shows the distribution of equity by state- black is Loan-to-value (LTV) of less than 80%, blue is 80% to 100%, red is a LTV of greater than 100% (or negative equity). Note: This only includes homeowners with a mortgage - about 31% of homeowners nationwide do not have a mortgage.
Some states - like New York - have a large percentage of borrowers with more than 20% equity, and Nevada, Arizona and Florida have the fewest borrowers with more than 20% equity.
Some interesting data on borrowers with and without home equity loans from CoreLogic: "Of the 11.1 million upside-down borrowers, there are 6.7 million first liens without home equity loans. This group of borrowers has an average mortgage balance of $219,000 and is underwater by an average of $51,000 or an LTV ratio of 130 percent.
The remaining 4.4 million upside-down borrowers had both first and second liens. Their average mortgage balance was $306,000 and they were upside down by an average of $84,000 or a combined LTV of 138 percent."


