by Calculated Risk on 3/21/2012 02:37:00 PM
Wednesday, March 21, 2012
Existing Home Sales: Inventory and NSA Sales Graph
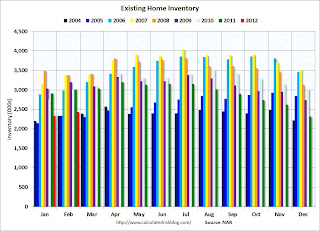
The NAR reported inventory increased seasonally to 2.43 million in February. This is down 19.3% from February 2011, and up 4% from the inventory level in February 2005 (mid-2005 was when inventory started increasing sharply). This decline in inventory has been a significant story over the last year.
There are several possible reasons for the decline:
• The NAR reports active listings, and although there is some variability across the country in what is considered active, most "contingent short sales" are not included. "Contingent short sales" are strange listings since the listings were frequently NEVER on the market (they were listed as contingent), and they hang around for a long time - they are probably more closely related to shadow inventory than active inventory. However when we comparing inventory to 2005, we need to remember there were no "short sale contingent" listings in 2005. In the areas I track, the number of "short sale contingent" listings is down sharply year-over-year.
• There are probably a large number of sellers "waiting for a better market", and we could call this pent-up supply. When the market eventually improves, this pent-up supply will come on the market and probably keep prices from rising - but having less listed inventory now means less downward pressure on prices now.
• There is a seasonal pattern for inventory, and usually December and January have the lowest inventory levels for the year. Although there is some variability, usually inventory increases about 10% to 15% from January to mid-summer. That would put inventory at around 2.55 to 2.7 million by July (up from 2.33 million in January). At the current sales rate, this would push the months-of-supply measure up to 6.7 to 7.1 months from the current 6.4 months. The inventory increase from January to February was the normal seasonal increase.
• The number of completed foreclosures declined in 2011 and are expected to increase in 2012. This will probably lead to more REO (lender Real Estate Owned) listed for sale and some increase in the level of inventory.
I don't think this increase will be huge. My guess is that at most this will add 200 thousand listed REOs to the expected seasonal increase that would put listed inventory at 2.75 to 2.9 million in mid-summer - or about 7.2 to 7.6 months-of-supply at the current sales rate. That is higher than normal, but inventory would still be down 10% or more from 2011.
• Tom Lawler has pointed out that there has been a substantial increase in the number of SF homes purchased by investors with the explicit intention to rent the homes out for several years and this is probably another reason for the decline in invnetory.
The bottom line is the decline in listed inventory is a big deal, and will lead to less downward pressure on prices. Just like last year, inventory will be something to watch closely all year.
The following graph shows inventory by month since 2004. In 2005 (dark blue columns), inventory kept rising all year - and that was a clear sign that the housing bubble was ending.
 Click on graph for larger image.
This year (dark red for 2012) inventory is at the lowest level for a February since 2005. Inventory is still elevated - especially with the much lower sales rate - but lower inventory levels put less downward pressure on house prices (of course the level of distressed properties is still very high, and there is a significant shadow inventory).
The following graph shows existing home sales Not Seasonally Adjusted (NSA).
 Sales NSA (red column) are above the sales for the last four years (2008 through 2011), but well below the bubble years of 2005 and 2006.
The level of sales is still elevated due to investor buying. The NAR noted:
All-cash sales rose to 33 percent of transactions in February from 31 percent in January; they were 33 percent in February 2011. Investors account for the bulk of cash transactions.Earlier:
Investors purchased 23 percent of homes in February, unchanged from January; they were 20 percent in February 2011.
• Existing Home Sales in February: 4.59 million SAAR, 6.4 months of supply
• Existing Home Sales graphs


