by Calculated Risk on 3/17/2012 08:16:00 AM
Saturday, March 17, 2012
Summary for Week ending March 16th
There were several key stories this week: 15 of 19 large bank holding companies passed the recent Fed stress tests, the mortgage settlement was filed with the court, and, over in Europe, the IMF and EU approved new funding for Greece.
The U.S. economic data was mostly positive. Retail sales in February increases 1.1% from January, weekly initial unemployment claims declined to 351,000, and core inflation eased slightly (although overall inflation was up sharply due to higher gasoline prices). Gasoline prices probably pushed down consumer sentiment a little in March.
For manufacturing, industrial production and capacity utilization were a little weaker than expected, although January was revised up. And the Empire State and Philly Fed surveys showed stronger expansion in March.
Overall a positive week. Next week will be mostly about housing.
Here is a summary in graphs:
• Retail Sales increased 1.1% in February
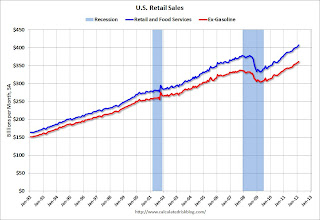
 On a monthly basis, retail sales were up 1.1% from January to February (seasonally adjusted, after revisions), and sales were up 6.5% from February 2011. Ex-autos, retail sales increased 0.9% in February.
Sales for January were revised up from a 0.4% increase to a 0.6% increase.
This graph shows retail sales since 1992. This is monthly retail sales and food service, seasonally adjusted (total and ex-gasoline).
Retail sales are up 22.6% from the bottom, and now 7.8% above the pre-recession peak (not inflation adjusted)
This was below the consensus forecast for retail sales of a 1.2% increase in February, but above the consensus for a 0.8% increase ex-auto.
• Industrial Production unchanged in February, Capacity Utilization declines
 From the Fed: Industrial production and Capacity Utilization
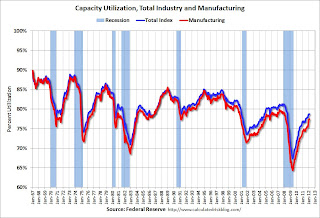
 This graph shows Capacity Utilization. This series is up 11.3 percentage points from the record low set in June 2009 (the series starts in 1967).
Capacity utilization at 78.7% is still 1.6 percentage points below its average from 1972 to 2010 and below the pre-recession levels of 81.3% in December 2007. Capacity utilization for January was revised up from 78.5% to 78.8%.
Note: y-axis doesn't start at zero to better show the change.
 The second graph shows industrial production since 1967.
Industrial production was unchanged in February at 96.2; however January was revised up 0.4%.
The consensus was for a 0.4% increase in Industrial Production in February, and for an increase to 78.8% (from 78.5%) for Capacity Utilization. Although below consensus, with the January revisions, this was close to expectations.
• Philly Fed and Empire State Manufacturing Surveys indicate slightly stronger expansion in March
From the Philly Fed: March 2012 Business Outlook Survey "The survey's broadest measure of manufacturing conditions, the diffusion index of current activity, edged slightly higher, from a reading of 10.2 in February to 12.5, its highest reading since April of last year"
From the NY Fed: Empire State Manufacturing Survey "The general business conditions index was little changed in March and, at 20.2, indicated a continued moderate pace of growth in business activity for New York State manufacturers."
 Here is a graph comparing the regional Fed surveys and the ISM manufacturing index. The dashed green line is an average of the NY Fed (Empire State) and Philly Fed surveys through March. The ISM and total Fed surveys are through February.
The average of the Empire State and Philly Fed surveys increased slightly again in March, and is at the highest level since April 2011.
Both surveys indicated expansion in March, at a slightly faster pace than in February, and both were slightly above the consensus forecast.
• Weekly Initial Unemployment Claims decline to 351,000
 The dashed line on the graph is the current 4-week average. The four-week average of weekly unemployment claims was unchanged at 355,750.
The 4-week moving average is near the lowest level since early 2008.
• Key Measures of Inflation in February
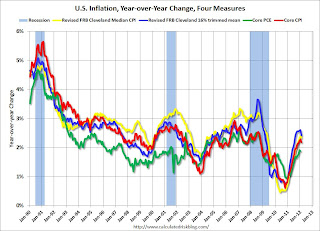
 This graph shows the year-over-year change for four key measures of inflation: Core CPI, trimmed-mean CPI, median CPI, and core PCE. On a year-over-year basis, the median CPI rose 2.3%, the trimmed-mean CPI rose 2.4%, and core CPI rose 2.2%. Core PCE is for February and increased 1.88% year-over-year.
 These measures show inflation on a year-over-year basis is still above the Fed's 2% target, however on a monthly basis, the rate of increase was below the Fed's target.
• BLS: Job Openings unchanged in January
 This graph shows job openings (yellow line), hires (dark blue), Layoff, Discharges and other (red column), and Quits (light blue column) from the JOLTS.
 This is a new series and only started in December 2000.
Notice that hires (dark blue) and total separations (red and light blue columns stacked) are pretty close each month. When the blue line is above the two stacked columns, the economy is adding net jobs - when it is below the columns, the economy is losing jobs.
Jobs openings were unchanged in January, and the number of job openings (yellow) has generally been trending up, and are up about 21% year-over-year compared to January 2011.
Quits declined slightly in January, and quits are now up about 9% year-over-year. These are voluntary separations and more quits might indicate some improvement in the labor market. (see light blue columns at bottom of graph for trend for "quits").
• Consumer Sentiment declines in March to 74.3
 The preliminary Reuters / University of Michigan consumer sentiment index for March declined to 74.3, down from the February reading of 75.3.
This was below the consensus forecast of an increase to 75.6 and the decline was probably related to higher gasoline prices. Overall sentiment is still fairly weak, although sentiment has rebounded from the decline last summer.
• NFIB: Small Business Optimism increases slightly in February
From the National Federation of Independent Business (NFIB): Historically Low Business Confidence Begins to Edge Up, Ever so Slightly
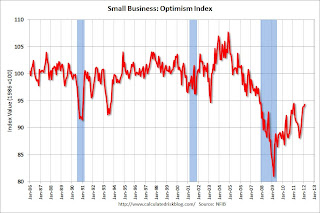
 This graph shows the small business optimism index since 1986. The index increased to 94.3 in February from 93.9 in January. This is the sixth increase in a row after for the index, and the index is now at second highest level since December 2007 (the index was slightly higher - at 94.5 - in February 2011).
This index is still low - probably due to a combination of sluggish growth, and the high concentration of real estate related companies in the index.
• Other Economic Stories ...
• Mortgage Settlement filed with Court
• State Unemployment Rates "generally lower" in January
• LA area Port Traffic declines in February
• FOMC Statement: No changes, economy "expanding moderately"
• Fed: 15 of 19 Banks passed adverse stress test scenario


