by Calculated Risk on 4/19/2012 05:16:00 PM
Thursday, April 19, 2012
Homeowner Financial Obligation Ratio near normal, Mortgage obligations still high
From Floyd Norris at the NY Times: Debt Burden Lifting, Consumers Open Wallets a Crack
One measure of the financial health of householders is the level of financial obligations, like required mortgage and credit card payments, to disposable income. By the fall of 2007, those obligations took up 14 percent of disposable income, more than at any time since the Federal Reserve began calculating the statistic in 1980.Norris is referring to the Debt Service Ratio (DSR) from the Federal Reserve.
But now the situation has turned around. The latest figures, for the final quarter of 2011, show that required debt service payments now make up just 10.9 percent of disposable income, the lowest proportion since 1994. A broader measure — which adds in such obligations as property tax and insurance premiums for homeowners, and rent for those who do not own their homes — has fallen to the lowest level since 1984.
There is little mystery in how that happened. First, debt levels have fallen. ... Second, low interest rates mean that servicing that debt costs less. ...
Getting those debt levels down was not a simple matter of making payments, of course. The McKinsey Global Institute estimates that about two-thirds of the reduction came from the cancellation of debt, through write-offs and foreclosures.
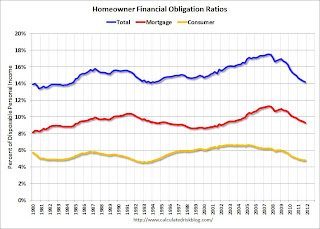
I also like to look at the Financial Obligation Ratio (FOR) for homeowners.
Note: This series is useful to look for changes over time, but there are limitations. From the Fed:
The limitations of current sources of data make the calculation of the ratio especially difficult. The ideal data set for such a calculation would have the required payments on every loan held by every household in the United States. Such a data set is not available, and thus the calculated series is only a rough approximation of the current debt service ratio faced by households. Nonetheless, this rough approximation may be useful if, by using the same method and data series over time, it generates a time series that captures the important changes in household debt service payments.
 Click on graph for larger image.
This graph shows the Total, Mortgage and Consumer financial obligation ratios for homeowners.
With some decline in debt, and much lower interest rates, the total homeowner financial obligations ratio is back to normal levels. However the mortgage ratio - even with record low mortgage rates - is still somewhat high.
Back in the early '90s, following the previous surge in mortgage obligations, the mortgage ratio declined for about 9 years. For the mortgage ratio to decline further, it would take a combination of more debt reduction and - hopefully - more disposable income.


