by Calculated Risk on 4/03/2012 09:24:00 AM
Tuesday, April 03, 2012
LPS: February Foreclosure Starts and Sales Reversed Prior Month’s Increases
LPS released their Mortgage Monitor report for February today.
According to LPS, 7.57% of mortgages were delinquent in February, down sharply from 7.97% in January, and down from 8.80% in February 2011.
LPS reports that 4.13% of mortgages were in the foreclosure process, down slightly from 4.15% in January, and down slightly from 4.15% in February 2011.
This gives a total of 11.7% delinquent or in foreclosure. It breaks down as:
• 2,059,000 loans less than 90 days delinquent.
• 1,722,000 loans 90+ days delinquent.
• 2,065,000 loans in foreclosure process.
For a total of 5,846,000 loans delinquent or in foreclosure in February.
 Click on graph for larger image.
This graph shows the total delinquent and in-foreclosure rates since 1995.
The total delinquent rate has fallen to 7.57% from the peak in January 2010 of 10.97%, but the decline has halted. A normal rate is probably in the 4% to 5% range, so there is a long ways to go.
The in-foreclosure rate was at 4.11%, down from the record high in October 2011 of 4.29%. There are still a large number of loans in this category (about 2.07 million).
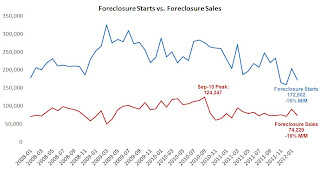
 This graph provided by LPS Applied Analytics shows foreclosure starts and sales.
Foreclosure starts and sales were up in January, but then declined in February. This was before the mortgage servicer settlement was announced in mid-February and filed with the court in March, so it is still too early to see the impact of the settlement.


