by Calculated Risk on 5/16/2012 08:30:00 AM
Wednesday, May 16, 2012
Housing Starts increase to 717,000 in April
From the Census Bureau: Permits, Starts and Completions
Housing Starts:
Privately-owned housing starts in April were at a seasonally adjusted annual rate of 717,000. This is 2.6 percent (±14.8%)* above the revised March estimate of 699,000 and is 29.9 percent (±15.2%) above the revised April 2011 rate of 552,000.
Single-family housing starts in April were at a rate of 492,000; this is 2.3 percent (±11.9%)* above the revised March figure of 481,000. The April rate for units in buildings with five units or more was 217,000.
Building Permits:
Privately-owned housing units authorized by building permits in April were at a seasonally adjusted annual rate of 715,000. This is 7.0 percent (±1.0%) below the revised March rate of 769,000, but is 23.7 percent (±1.9%) above the revised April 2011 estimate of 578,000.
Single-family authorizations in April were at a rate of 475,000; this is 1.9 percent (±1.1%) above the revised March figure of 466,000. Authorizations of units in buildings with five units or more were at a rate of 217,000 in April.
 Click on graph for larger image.
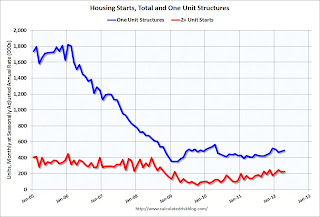
Total housing starts were at 717 thousand (SAAR) in April, up 2.6% from the revised March rate of 699 thousand (SAAR). Note that March was revised up sharply from 654 thousand.
Single-family starts increased 2.3% to 492 thousand in April. March was revised up to 481 thousand from 462 thousand.
The second graph shows total and single unit starts since 1968.
 This shows the huge collapse following the housing bubble, and that total housing starts have been increasing lately after moving sideways for about two years and a half years.
 Total starts are up 50% from the bottom, and single family starts are up 39% from the low.
This was above expectations of 690 thousand starts in April, and was especially strong given the upward revisions to prior months.
The housing recovery continues.


