by Calculated Risk on 5/14/2012 12:15:00 PM
Monday, May 14, 2012
Oil and Gasoline Prices, and the Reversal of Seaway Pipeline
Oil prices have fallen sharply, and once again gasoline prices are lagging. But if oil prices stay at this level - or fall further - then gasoline prices should decline further too (there are always some refinery issues).
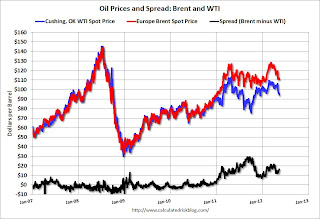
First, gasoline prices tend to track international oil prices, so we need to compare gasoline to Brent oil prices, and not WTI (West Texas Intermediate). A "glut" of oil at Cushing pushed down WTI prices relative to Brent over the last few years, but the spread has narrowed some now that a key pipeline is being reversed.
From Bloomberg: Sweet Crude From Seaway Pipeline Offered in the U.S. Gulf
Low-sulfur oil delivered from the soon-to-be reversed Seaway pipeline is being offered in the U.S. Gulf Coast for June delivery.This following graph shows the prices for Brent and WTI over the last few years.
Enterprise Product Partners LP (EPD) and Enbridge Inc. (ENB) are reversing the pipeline and on May 17 will begin shipping oil from the storage hub at Cushing, Oklahoma, to the Gulf. It is expected to narrow the discount of inland U.S. grades to imports and Gulf Coast production.
The first phase will carry 150,000 barrels a day on the 500-mile (800-kilometer) line, with subsequent phases expanding capacity to 850,000 barrels a day by mid-2014.
 Click on graph for larger image.
The spread narrowed last year with the announcement of the partial reversal of the Seaway pipeline. The spread will probably narrow further as the capacity is expanded.
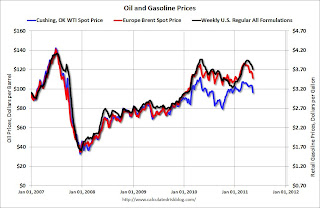
The second graphs shows that gasoline prices track Brent more than WTI.
 Before the spread emerged, WTI and Brent tracked closely - and retail gasoline prices tracked pretty closely too.
Once the "glut" emerged, gasoline prices tracked Brent oil prices. Brent was as high as $128 per barrel in March, and gasoline prices peaked at $3.94 (weekly basis) in early April.
We will probably see a similar lag this time, with gasoline prices falling to below $3.50 per gallon by early June (if oil prices stay at this level). It wouldn't be a surprise if most of the decline in gasoline prices happened after Memorial Day (May 28th).
And below is a graph of gasoline prices. Gasoline prices have been slowly moving down since peaking in early April. Note: The graph below shows oil prices for WTI; as noted above, gasoline prices in most of the U.S. are impacted more by Brent prices.
| Orange County Historical Gas Price Charts Provided by GasBuddy.com |


