by Calculated Risk on 5/05/2012 08:05:00 AM
Saturday, May 05, 2012
Summary for Week ending May 4th
The key report – the April employment report – was disappointing. With only 115 thousand jobs added in April, this has raised a key question: Is this a slowdown in hiring, or were the January and February numbers boosted by the mild weather, and the apparently slowdown in March and April was just some "payback"?
If the former, hiring has slowed to about 135,000 per month (or less); if the later, the economy is adding about 200,000 jobs per month. Note: Through the first four months of 2012, the economy has added 803 thousand payroll jobs, a better pace than in 2011.
There are some positives we’ve discussed lately: it appears state and local government layoffs are slowing (although there was a little increase in April), residential investment (and construction employment) is increasing from a very low level, and it appears the drag from several sectors of non-residential investment will end mid-year. So my guess is job growth will pick up from the March and April pace, but remain sluggish compared to the slack in the labor force.
The other data was mixed. The ISM manufacturing index was above expectations, but the ISM service index was below. The Chicago PMI was soft, but auto sales were solid at a 14.4 million seasonally adjusted annual rate (SAAR).
Here is a summary in graphs:
• April Employment Report: 115,000 Jobs, 8.1% Unemployment Rate
 Click on graph for larger image.
There were 115,000 payroll jobs added in April, with 130,000 private sector jobs added, and 15,000 government jobs lost. The unemployment rate declined to 8.1%. The participation rate decreased to 63.6% from 63.8% (a new cycle low) and the employment population ratio also decreased slightly to 58.4%.
The change in February payroll employment was revised up from +240,000 to +259,000, and February was revised up from +120,000 to +154,000.
This was below expectations of 165,000 payroll jobs added.
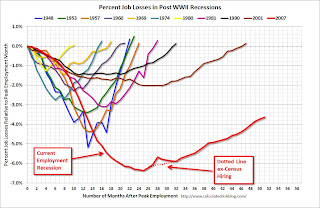 The second graph shows the job losses from the start of the employment recession, in percentage terms. The dotted line is ex-Census hiring.
This shows the depth of the recent employment recession - worse than any other post-war recession - and the relatively slow recovery due to the lingering effects of the housing bust and financial crisis.
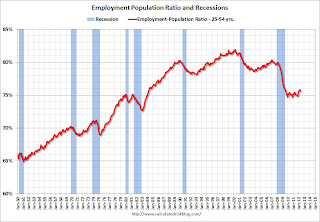 Since the participation rate has declined recently due to cyclical (recession) and demographic (aging population) reasons, an important graph is the employment-population ratio for the key working age group: 25 to 54 years old.
In the earlier period the employment-population ratio for this group was trending up as women joined the labor force. The ratio has been mostly moving sideways since the early '90s, with ups and downs related to the business cycle.
This ratio should probably move back to or above 80% as the economy recovers. So far the ratio has only increased slightly from a low of 74.7% to 75.7% in April (this was down slightly in April from March.)
• ISM Manufacturing index indicates faster expansion in April
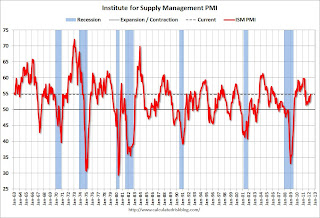 PMI was at 54.8% in April, up from 53.4% in March. The employment index was at 57.3%, up from 56.1%, and new orders index was at 58.2%, up from 54.5%.
Here is a long term graph of the ISM manufacturing index.
This was above expectations of 53.0%. This suggests manufacturing expanded at a faster rate in April than in March. It appears manufacturing employment expanded faster in April with the employment index at 57.3%.
• U.S. Light Vehicle Sales at 14.42 million annual rate
 Based on an estimate from Autodata Corp, light vehicle sales were at a 14.42 million SAAR in April. That is up 9.8% from April 2011, and up 0.7% from the sales rate last month (14.3 million SAAR in March 2012).
This was at the consensus forecast of 14.4 million SAAR (seasonally adjusted annual rate).
This graph shows the huge collapse in sales in the 2007 recession. This also shows the impact of the tsunami and supply chain issues on sales, especially in May and June of last year.
• Construction Spending increases slightly in March
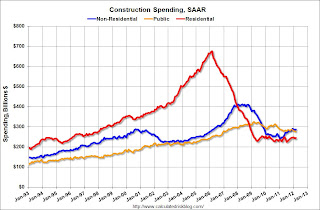 This graph shows private residential and nonresidential construction spending, and public spending, since 1993. Note: nominal dollars, not inflation adjusted.
Private residential spending is 64% below the peak in early 2006, and up 8.4% from the recent low. Non-residential spending is 30% below the peak in January 2008, and up about 18% from the recent low.
Public construction spending is now 15% below the peak in March 2009 and at a new post-bubble low.
On a year-over-year basis, both private residential and non-residential construction spending are positive, but public spending is down on a year-over-year basis. The year-over-year improvements in private non-residential are mostly due to energy spending (power and electric).
• ISM Non-Manufacturing Index indicates slower expansion in April
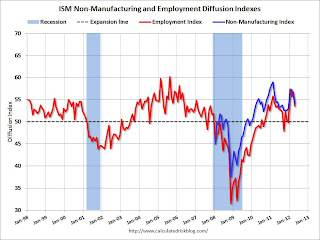 The April ISM Non-manufacturing index was at 53.5%, down from 56.0% in March. The employment index decreased in April to 54.2%, down from 56.7% in March. Note: Above 50 indicates expansion, below 50 contraction.
 This graph shows the ISM non-manufacturing index (started in January 2008) and the ISM non-manufacturing employment diffusion index.
This was below the consensus forecast of 55.9% and indicates slower expansion in April than in March.
• Weekly Initial Unemployment Claims decline to 365,000
 The DOL reports:
In the week ending April 28, the advance figure for seasonally adjusted initial claims was 365,000, a decrease of 27,000 from the previous week's revised figure of 392,000. The 4-week moving average was 383,500, an increase of 750 from the previous week's revised average of 382,750.The dashed line on the graph is the current 4-week average. The four-week average of weekly unemployment claims increased to 383,500.
This is the highest level for the 4-week moving average since last December.
This was below the consensus of 378,000. However, even though weekly claims declined, the 4-week average has increased for four straight weeks and is at the highest level this year.
• Other Economic Stories ...
• Trulia on Houses: Asking Prices increase slightly Year-over-year in April
• LPS: March Foreclosure Starts increase, Foreclosure Sales lowest since December 2010
• ADP: Private Employment increased 119,000 in April
• Chicago PMI declines to 56.2
• Personal Income increased 0.4% in March, Spending 0.3%
• Q1 2012 GDP Details: Office and Mall Investment falls to record low, Single Family investment increases
• Restaurant Performance Index increases in March
• Fannie Mae and Freddie Mac Serious Delinquency rates declined in March


