by Calculated Risk on 5/19/2012 08:27:00 AM
Saturday, May 19, 2012
Summary for Week of May 18th
The headlines last week were once again mostly about Europe and Greece, especially the possibility of Greece exiting the euro (aka "Grexit") after the next election on June 17th. The outcome of the election is uncertain, although most Greeks and European policymakers would like Greece to stay in the euro. One thing is certain, Greece will be in the headlines for at least another month.
Most of the US economic data was at or above expectations last week. An exception was the Philly Fed manufacturing survey, but that was partially offset by faster expansion in the Empire State survey.
Housing starts were solid as the slow housing recovery continues. Industrial production and capacity utilization increased, and the mortgage deliquencies are trending down.
The US economy remains sluggish. However, excluding Europe (and other international issues), the outlook would be improving. Two key questions are: what will happen in Greece and Europe? and how will that impact the US economy? I'll try to add some thoughts soon, but even with the problems in Europe, a recession in the US seems unlikely this year.
Here is a summary in graphs:
• Housing Starts increased to 717,000 in April
 Click on graph for larger image.
Total housing starts were at 717 thousand (SAAR) in April, up 2.6% from the revised March rate of 699 thousand (SAAR). Note that March was revised up sharply from 654 thousand to 699 thousand..
Single-family starts increased 2.3% to 492 thousand in April. March was revised up to 481 thousand from 462 thousand.
Total starts are up 50% from the bottom, and single family starts are up 39% from the low.
This was above expectations of 690 thousand starts in April, and was especially strong given the upward revisions to prior months.
• Retail Sales increased 0.1% in April
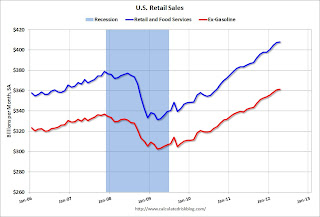
 On a monthly basis, retail sales were up 0.1% from March to April (seasonally adjusted), and sales were up 6.4% from April 2011. Ex-autos, retail sales also increased 0.1% in April.
Sales for March was revised down to a 0.7% increase from 0.8%, and February was revised down to 1.0% from 1.1%.
This graph shows monthly retail sales and food service, seasonally adjusted (total and ex-gasoline).
Retail sales are up 23.1% from the bottom, and now 7.7% above the pre-recession peak (not inflation adjusted)
This was at the consensus forecast for retail sales of a 0.1% increase in April, and below the consensus for a 0.2% increase ex-auto.
• Industrial Production up in April, Capacity Utilization increases
 This graph shows Capacity Utilization. This series is up 12.4 percentage points from the record low set in June 2009 (the series starts in 1967).
Capacity utilization at 79.2% is still 1.1 percentage points below its average from 1972 to 2010 and below the pre-recession levels of 80.6% in December 2007.
Note: y-axis doesn't start at zero to better show the change.
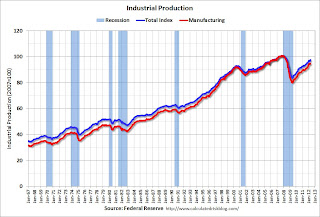
 The second graph shows industrial production since 1967.
Industrial production increased in April to 97.4. March was revised down (so the month-to-month increase was greater than expected), and February was revised up.
The consensus was for a 0.5% increase in Industrial Production in April, and for an increase to 79.0% (from 78.7%) for Capacity Utilization. This was above expectations.
• MBA: Mortgage Delinquencies decline in Q1
 The MBA reported that 11.79 percent of mortgage loans were either one payment delinquent or in the foreclosure process in Q1 2012 (delinquencies seasonally adjusted). This is down from 11.96 percent in Q4 2011 and is the lowest level since 2008.
This graph is from the MBA and shows the percent of loans in the foreclosure process by state. Posted with permission.
The top states are Florida (14.31% in foreclosure), New Jersey (8.37%), Illinois (7.46%), Nevada (the only non-judicial state in the top 10 at 6.47%), and New York (6.17%).
As Jay Brinkmann, MBA’s Chief Economist and Senior Vice President for Research and Education noted, the biggest problem is the number of loans in the foreclosure process. This is primarily a problem in states with a judicial foreclosure process. States like California and Arizona are now below the national average of percent of loans in the foreclosure process.
 The second graph shows the percent of loans delinquent by days past due.
Loans 30 days delinquent decreased to 3.13% from 3.22% in Q4. This is at about 2007 levels and around the long term average.
Delinquent loans in the 60 day bucket decreased to 1.21% in Q1, from 1.25% in Q4. This is the lowest level since Q4 2007.
There was a decrease in the 90+ day delinquent bucket too. This decreased to 3.06% from 3.11% in Q4 2011. This is the lowest level since 2008, but still way above normal (around 0.8% would be normal according to the MBA).
The percent of loans in the foreclosure process increased slightly to 4.39% from 4.38%.
• Regional manufacturing activity mixed in May Surveys
From the Philly Fed: May 2012 Business Outlook Survey
Firms responding to the May Business Outlook Survey indicated that manufacturing growth fell back from the pace of recent months. The survey’s broad indicators for general activity fell into negative territory for the first time in eight months. Indicators for new orders and employment also suggested slight declines from April.
 From the NY Fed: May Empire State Manufacturing Survey indicates manufacturing activity expanded at a moderate pace
The May Empire State Manufacturing Survey indicates that manufacturing activity expanded in New York State at a moderate pace. The general business conditions index rose eleven points to 17.1.
Here is a graph comparing the regional Fed surveys and the ISM manufacturing index. The dashed green line is an average of the NY Fed (Empire State) and Philly Fed surveys through May. The ISM and total Fed surveys are through April.
The NY and Philly Fed surveys went in opposite directions this month. The NY Fed survey showed stronger expansion; the Philly Fed survey indicated contraction. The average of the Empire State and Philly Fed surveys declined in May, and is at the lowest level this year.
• Weekly Initial Unemployment Claims at 370,000
 The DOL reports:
In the week ending May 12, the advance figure for seasonally adjusted initial claims was 370,000, unchanged from the previous week's revised figure of 370,000. The 4-week moving average was 375,000, a decrease of 4,750 from the previous week's revised average of 379,750.The dashed line on the graph is the current 4-week average. The four-week average of weekly unemployment claims decreased to 375,000.
The 4-week average has declined for two consecutive weeks. The average has been between 363,000 and 384,000 all year.
This was above the consensus of 365,000.
• AIA: Architecture Billings Index indicates contraction in April
 From AIA: Architecture Billings Index Reverts to Negative Territory
After five months of positive readings, the Architecture Billings Index (ABI) has fallen into negative terrain. ... The American Institute of Architects (AIA) reported the April ABI score was 48.4, following a mark of 50.4 in March.This graph shows the Architecture Billings Index since 1996. The index was at 48.4 in April. Anything below 50 indicates contraction in demand for architects' services.
Note: This includes commercial and industrial facilities like hotels and office buildings, multi-family residential, as well as schools, hospitals and other institutions.
According to the AIA, there is an "approximate nine to twelve month lag time between architecture billings and construction spending" on non-residential construction. This is just one month - and as Baker noted, this might be payback for the mild weather earlier in the year - but this suggests CRE investment will stay weak all year (it will be some time before investment in offices and malls increases).
• Key Measures of Inflation in April

According to the Federal Reserve Bank of Cleveland, the median Consumer Price Index rose 0.2% (2.3% annualized rate) in April. The 16% trimmed-mean Consumer Price Index increased 0.2% (1.9% annualized rate) during the month. The median CPI and 16% trimmed-mean CPI are measures of core inflation calculated by the Federal Reserve Bank of Cleveland based on data released in the Bureau of Labor Statistics' (BLS) monthly CPI report.This graph shows the year-over-year change for core CPI, core PCE, median CPI and the trimmed-mean CPI. On a year-over-year basis, the median CPI rose 2.4%, the trimmed-mean CPI rose 2.3%, and core CPI rose 2.3%. Core PCE is for March and increased 2.0% year-over-year.
...
Earlier today, the BLS reported that the seasonally adjusted CPI for all urban consumers was flat at 0.0% (0.4% annualized rate) in April. The CPI less food and energy increased 0.2% (2.9% annualized rate) on a seasonally adjusted basis.
These measures show inflation on a year-over-year basis is mostly still above the Fed's 2% target.
• Other Economic Stories ...
• NAHB Builder Confidence increases in May, Highest since May 2007
• Lawler: Early Read on Existing Home Sales in April
• Greece: Election is June 17th
• Hotels: RevPAR increases 4.5% compared to same week in 2011
• State Unemployment Rates decline in 37 states in April


