by Calculated Risk on 7/28/2012 08:02:00 AM
Saturday, July 28, 2012
Summary for Week ending July 27th
This was one of those weeks were Europe stole the headlines, especially comments from ECB President Mario Draghi. Of course Draghi has said before that the ECB would do “whatever it takes”, so this wasn’t really new news.
Here was Lou Barnes reaction:
Sentiment turned yesterday on ECB President Mario Draghi's "...The ECB is ready to do whatever it takes to preserve the euro. Believe me, it will be enough." He went on to announce his plans to date Jennifer Lopez tonight, Kim Bassinger tomorrow, and win the decathlon gold next week.Once again the economic data was weak. Real GDP for Q2 was reported at a 1.5% annualized rate. And even new home sales were below expectations, although with upward revisions to previous months – and an expected upward revision to the June sales rate – the report was actually fairly solid.
If a central bank has to promise to preserve something, odds are high that it is already dead. This is the talk of 0-10 football coaches. Imagine if an American Fed Chair said he would "preserve the dollar." Not defend its value versus other currencies; not prevent inflation or deflation, but preserve its existence? Elbow the women and children out of the lifeboats.
Manufacturing data was weak again, with the Richmond survey falling off a cliff, and the MarkIt Flash PMI declining in July. However the Kansas City manufacturing survey showed modest growth.
In other data, consumer sentiment was up slightly, weekly initial unemployment claims were down, and the trucking index increased. All of this data suggests more sluggish growth.
Here is a summary of last week in graphs:
• Real GDP increased 1.5% annual rate in Q2
The Q2 GDP report was weak, but slightly better than expected. Final demand weakened in Q2 as personal consumption expenditures increased at only a 1.5% annual rate, and residential investment increased at a 9.7% annual rate.
 Click on graph for larger image.
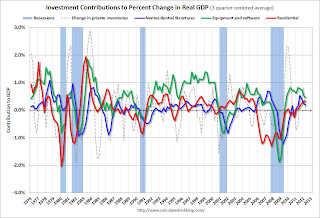
This graph shows the contribution to GDP from residential investment, equipment and software, and nonresidential structures (3 quarter centered average). This is important to follow because residential investment tends to lead the economy, equipment and software is generally coincident, and nonresidential structure investment trails the economy.
For this graph, red is residential, green is equipment and software, and blue is investment in non-residential structures. So the usual pattern - both into and out of recessions is - red, green, blue.
The dashed gray line is the contribution from the change in private inventories.
Residential Investment (RI) made a positive contribution to GDP in Q2 for the fifth consecutive quarter. Usually residential investment leads the economy, but that didn't happen this time because of the huge overhang of existing inventory, but now RI is contributing. The good news: Residential investment has clearly bottomed.
 Residential Investment as a percent of GDP is still near record lows, but it is increasing. Usually RI bounces back quickly following a recession, but this time there is a wide bottom because of the excess supply of existing vacant housing units.
 Last year the increase in RI was mostly from multifamily and home improvement investment. Now the increase is from most categories including single family. I'll break down Residential Investment (RI) into components after the GDP details are released this coming week. Note: Residential investment (RI) includes new single family structures, multifamily structures, home improvement, broker's commissions, and a few minor categories.
 Overall the revisions to the last three years were pretty minor.
 This graph shows GDP per quarter as a percent change annualized.
There were some downward revisions in Q1 and Q2 2010, and some upward revisions in 2011.
This was slightly above expectations.
• New Home Sales declined in June to 350,000 Annual Rate
 The Census Bureau reports New Home Sales in June were at a seasonally adjusted annual rate (SAAR) of 350 thousand. This was down from a revised 382 thousand SAAR in May (revised up from 369 thousand). Sales in March and April were revised up too.
This graph shows New Home Sales vs. recessions since 1963. The dashed line is the current sales rate.
Even though sales are still very low, new home sales have clearly bottomed. New home sales have averaged 358 thousand SAAR over the first 6 months of 2012, after averaging under 300 thousand for the previous 18 months. All of the recent revisions have been up too.
So even though sales in June were below the consensus forecast of 370,000, this was still a fairly solid report given the upward revisions to previous months. Based on recent revisions, sales in June will probably be revised up too.
• Weekly Initial Unemployment Claims decline to 353,000
 The dashed line on the graph is the current 4-week average. The four-week average of weekly unemployment claims declined to 367,250.
The sharp swings over the last few weeks are apparently related to difficulty adjusting for auto plant shutdowns.
This was well below the consensus forecast of 380,000 and is the lowest level for the four week average since March.
• Final July Consumer Sentiment at 72.3
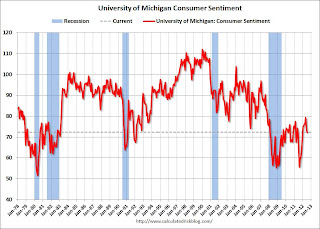
 The final Reuters / University of Michigan consumer sentiment index for July increased to 72.3 from the preliminary reading of 72.0, and was down from the June reading of 73.2.
This was slightly above the consensus forecast of 72.0 and the lowest level this year. Overall sentiment is still weak - probably due to a combination of the high unemployment rate and the sluggish economy.
• ATA Trucking index increased in June
 From ATA: ATA Truck Tonnage Jumped 1.2% in June
Here is a long term graph that shows ATA's For-Hire Truck Tonnage index.
The dashed line is the current level of the index. The index is above the pre-recession level and still up 3.7% year-over-year - but has been moving mostly sideways in 2012.
• Other Economic Stories ...
• DataQuick: California Foreclosure Activity Lowest in Five Years
• Markit Flash PMI falls to 51.8
• NAR: Pending home sales index decreased 1.4% in June
• Kansas City Fed: "Modest" Growth in Regional Manufacturing Activity in July
• From the Richmond Fed: Manufacturing Activity Contracted in July; Manufacturers' Optimism Waned


