by Calculated Risk on 7/07/2012 08:01:00 AM
Saturday, July 07, 2012
Summary for Week ending July 6th
The week started off with the ISM manufacturing index showing contraction for the first time since 2009, and ended with a disappointing employment report. Those were the key reports for the week - and they were dismal.
However, sandwiched in the middle of the week - around the July 4th Holiday - there was a little better news. Auto sales were stronger than expected, initial weekly unemployment claims declined, construction spending increased, and vacancy rates declined for two categories of commercial real estate in Q2 (but not for offices).
I'll have more on the employment report later today.
Here is a summary of last week in graphs:
• June Employment Report: 80,000 Jobs, 8.2% Unemployment Rate
 Click on graph for larger image.
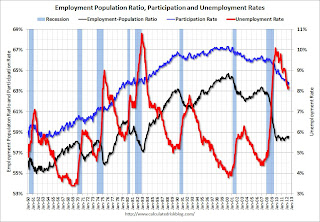
This graph shows the employment population ratio, the participation rate, and the unemployment rate. The unemployment rate was unchanged at 8.2% (red line).
The Labor Force Participation Rate was unchanged at 63.8% in June (blue line). This is the percentage of the working age population in the labor force.
The participation rate is well below the 66% to 67% rate that was normal over the last 20 years, although most of the recent decline is due to demographics.
The Employment-Population ratio was unchanged at 58.6% in June (black line).
 The second graph shows the job losses from the start of the employment recession, in percentage terms. The dotted line is ex-Census hiring.
This shows the depth of the recent employment recession - worse than any other post-war recession - and the relatively slow recovery due to the lingering effects of the housing bust and financial crisis.
The economy has added 902,000 jobs over the first half of the year (952,000 private sector jobs). At this pace, the economy would add around 1.9 million private sector jobs in 2012; less than the 2.1 million added in 2011.
However job growth has really slowed over the last three months with only 225,000 payroll jobs added (a 900,000 annual pace), and only 274,000 private sector jobs (a 1.1 million annual pace). This is very sluggish employment growth.
• ISM Manufacturing index declines in June to 49.7
 This is the first contraction in the ISM index since the recession ended in 2009. PMI was at 49.7% in June, down from 53.5% in May. The employment index was at 56.6%, down from 56.9%, and new orders index was at 47.8%, down from 60.1%.
Here is a long term graph of the ISM manufacturing index.
This was below expectations of 52.0%. This suggests manufacturing contracted in June for the first time since July 2009.
This was a weak report, and the decline in new orders was especially significant.
• U.S. Light Vehicle Sales at 14.1 million annual rate in June
 Based on an estimate from Autodata Corp, light vehicle sales were at a 14.08 million SAAR in June. That is up 22% from June 2011, and up 2.6% from the sales rate last month (13.73 million SAAR in May 2012).
This was above the consensus forecast of 13.9 million SAAR (seasonally adjusted annual rate).
This graph shows the historical light vehicle sales from the BEA (blue) and an estimate for June (red, light vehicle sales of 14.08 million SAAR from Autodata Corp).
Sales have averaged a 14.28 million annual sales rate through the first half of 2012, up sharply from the same period of 2011.
• ISM Non-Manufacturing Index declines, indicates slower expansion in June
 The June ISM Non-manufacturing index was at 52.1%, down from 53.7% in May. The employment index increased in June to 52.3%, up from 50.8% in May. Note: Above 50 indicates expansion, below 50 contraction.
 This graph shows the ISM non-manufacturing index (started in January 2008) and the ISM non-manufacturing employment diffusion index.
This was below the consensus forecast of 53.0% and indicates slower expansion in June than in May.
• Construction Spending in May: Private spending increases, Public Spending declines
 This week the Census Bureau reported that overall construction spending increased in May:
 The U.S. Census Bureau of the Department of Commerce announced today that construction spending during May 2012 was estimated at a seasonally adjusted annual rate of $830.0 billion, 0.9 percent above the revised April estimate of $822.5 billion. The May figure is 7.0 percent above the May 2011 estimate of $775.8 billion.This graph shows private residential and nonresidential construction spending, and public spending, since 1993. Note: nominal dollars, not inflation adjusted.
Private residential spending is 61% below the peak in early 2006, and up 17% from the recent low. Non-residential spending is 28% below the peak in January 2008, and up about 30% from the recent low.
Public construction spending is now 17% below the peak in March 2009 and at a new post-bubble low.
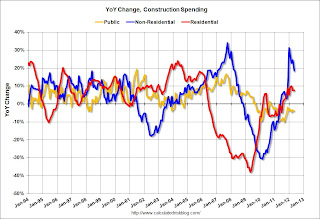
 The second graph shows the year-over-year change in construction spending.
On a year-over-year basis, both private residential and non-residential construction spending are positive, but public spending is down on a year-over-year basis. The year-over-year improvements in private non-residential is mostly related to energy spending (power and electric).
The year-over-year improvement in private residential investment is an important change (the positive in 2010 was related to the tax credit). Construction is now the "bright spot" for the economy, however the improvement in residential construction is being somewhat offset by declines in public construction spending.
• Reis: Office, Mall and Apartment Vacancy Rates for Q2
 This graph shows the office vacancy rate starting in 1980 (prior to 1999 the data is annual).
Reis is reporting the vacancy rate was unchanged at 17.2% in Q2, and down from 17.5% in Q2 2011. The vacancy rate peaked in this cycle at 17.6% in Q3 and Q4 2010.
As Reis noted, there are very few new office buildings being built in the US, and new construction will probably stay low for several years.
 Reis reported that the apartment vacancy rate (82 markets) fell to 4.7% in Q2 from 4.9% in Q1 2012. The vacancy rate was at 5.9% in Q2 2011 and peaked at 8.0% at the end of 2009.
This graph shows the apartment vacancy rate starting in 2005.
Reis is just for large cities, but this decline in vacancy rates - and increase in rents - is happening just about everywhere.
Reis also reported a strong increase in apartment rents.
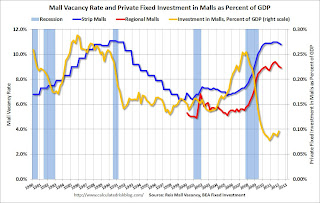
 Reis reported that the vacancy rate for regional malls declined slightly to 8.9% in Q2 from 9.0% in Q1. This is down from a cycle peak of 9.4% in Q3 of last year.
For Neighborhood and Community malls (strip malls), the vacancy rate declined to 10.8% in Q2, from 10.9% in Q1. For strip malls, the vacancy rate peaked at 11.0% in Q2 of last year.
This graph shows the strip mall vacancy rate starting in 1980 (prior to 2000 the data is annual). The yellow line shows mall investment as a percent of GDP. This isn't zero because this includes renovations and improvements. New mall investment has essentially stopped following the financial crisis.
• Weekly Initial Unemployment Claims decline to 374,000
 The DOL reports:
In the week ending June 30, the advance figure for seasonally adjusted initial claims was 374,000, a decrease of 14,000 from the previous week's revised figure of 388,000. The 4-week moving average was 385,750, a decrease of 1,500 from the previous week's revised average of 387,250.This graph shows the 4-week moving average of weekly claims since January 2000.
The dashed line on the graph is the current 4-week average. The four-week average of weekly unemployment claims declined slightly to 385,750.
This is just off the high for the year.
• Other Economic Stories ...
• ADP: Private Employment increased 176,000 in June
• AAR: Rail Traffic "mixed" in June, Intermodal at Record Level
• CoreLogic: House Price Index increases in May, Up 2.0% Year-over-year


