by Calculated Risk on 8/30/2012 06:55:00 PM
Thursday, August 30, 2012
Lawler: On the relationship between pending home sales and closed sales
Yesterday the National Association of Realtors reported that its “National” Pending Home Sales Index increased by 2.4% on a seasonally adjusted basis in July to its highest level since April 2010.
The NAR’s PHSI did not signal the “dip” in June/July closed existing home sales, for reasons that are difficult to discern. It’s not easy to figure out “fallout” rates from the PHSI for several reasons: first, the PHSI is an index number with 2001 “activity” equal to 100, making numerical comparisons to the NAR’s existing home sales estimate difficult, especially since there is a “discontinuity” in the NAR’s existing home sales methodology in 2007; and second, the NAR’s PHSI is based on a sample size not much more than half that used to estimate existing home sales. To really delve into the relationship between pending sales and closed sales, one needs to get local data—which unfortunately isn’t available to the public in that many places.
 Click on graph for larger image.
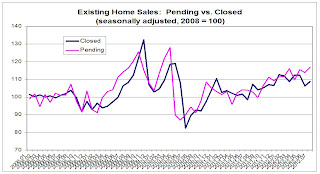
CR Note: This graph from Tom Lawler shows Pending and Closed home sales since January 2008. For this graph, Tom Lawler set both series to 100 in 2008.
More from Lawler: For fun, however, I looked at pending sales vs. closed sales data reported by MRIS for the mid-Atlantic region. While I have limited historical data, that data suggests that (1) contract fallout over the past two and a half years is up considerably from earlier periods; and (2) that increased fallout coincided with a significant increase in the share of pending sales that were “contingent. Other MRIS data/analyses suggests that a rise in the share of pending contracts that are short-sales, which (1) take much longer time to close; and (2) which have very high contract fall-out rates, has significantly impacted the relationship between pending sales and closed sales.
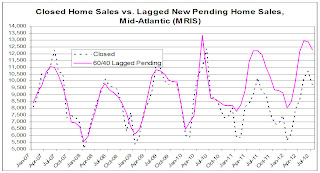
 Here is a chart showing closed home sales by MRIS for the mid-Atlantic region compared to lagged new pending contracts, using a weighting of 60% for the previous month and 40% for two months earlier.
This chart suggests that over the last two years the number of closed home sales has been significantly lower than one would have expected based on the past relationship between past new pending sales and closed sales. While not shown here, a more “sophisticated” look at leads and lags suggests that the reason is not simply delayed closings, but is mainly contract fallout.
CR Note: It appears short sales are distorting the relationship between pending and closed sales, and the "pending home sales" report should currently be taken with an extra grain of salt.


