by Calculated Risk on 10/27/2012 03:55:00 PM
Saturday, October 27, 2012
Schedule for Week of Oct 28th
Earlier:
• Summary for Week Ending Oct 26th
The key report this week is the October employment report to be released on Friday. Other key reports include the August Case-Shiller house price index on Tuesday, October auto sales on Thursday, and the October ISM manufacturing index, also on Thursday.
There are two interesting surveys that will be released on Monday; the Fed's Senior Loan Officer Survey that might show some slight increase in loan demand or loosening of lending standards, and the NMHC apartment survey that tends to lead other indicators of changes in the apartment market.
10:30 AM: Dallas Fed Manufacturing Survey for October. This is the last of the regional survey for October.
2:00 PM: The October 2012 Senior Loan Officer Opinion Survey on Bank Lending Practices from the Federal Reserve.
Expected: National Multi Housing Council (NMHC) Quarterly Apartment Survey. This is a key survey for apartment vacancy rates and rents.
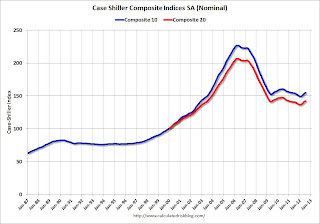
 9:00 AM: S&P/Case-Shiller House Price Index for August. Although this is the August report, it is really a 3 month average of June, July and August.
 This graph shows the nominal seasonally adjusted Composite 10 and Composite 20 indexes through May 2012 (the Composite 20 was started in January 2000).
The consensus is for a 2.1% year-over-year increase in the Composite 20 prices (NSA) for August. The Zillow forecast is for the Composite 20 to increase 1.7% year-over-year, and for prices to increase 0.2% month-to-month seasonally adjusted. The CoreLogic index increased 0.2% in August (NSA).
10:00 AM: Conference Board's consumer confidence index for October. The consensus is for an increase to 72.0 from 70.3 last month.
10:00 AM: Q3 Housing Vacancies and Homeownership report from the Census Bureau. This report is frequently mentioned by analysts and the media to track the homeownership rate, and the homeowner and rental vacancy rates. However, based on the initial evaluation, it appears the vacancy rates are too high. The Census Bureau is looking into the differences between the HVS, the ACS, and the decennial Census, and until the issues are resolved, this survey probably shouldn't be used to estimate the excess vacant housing supply.
9:45 AM: Chicago Purchasing Managers Index for October. The consensus is for an increase to 51.7, up from 49.7 in September.
8:30 AM: The initial weekly unemployment claims report will be released. The consensus is for claims to decrease to 365 thousand from 369 thousand.
8:30 AM: Productivity and Costs for Q3. The consensus is for a 1.3% increase in unit labor costs.
 10:00 AM ET: ISM Manufacturing Index for October.
 Here is a long term graph of the ISM manufacturing index. The ISM index indicated expansion in September, after three consecutive months of contraction. The consensus is for a decrease to 51.0, up from 51.5 in September. (above 50 is expansion).
10:00 AM: Construction Spending for September. The consensus is for a 0.7% increase in construction spending.
All day: Light vehicle sales for October. The consensus is for light vehicle sales to increase to 15.0 million SAAR in October (Seasonally Adjusted Annual Rate).
 This graph shows light vehicle sales since the BEA started keeping data in 1967. The dashed line is the September sales rate.
 TrueCar is forecasting:
The October 2012 forecast translates into a Seasonally Adjusted Annualized Rate (“SAAR”) of 14.9 million new car sales, up from 13.3 million in October 2011 and down from 14.94 million in September 2012Edmunds.com is forecasting:
Edmunds.com ... forecasts that 1,132,878 new cars will be sold in October for an estimated Seasonally Adjusted Annual Rate (SAAR) this month of 14.8 million light vehicles.
 8:30 AM: Employment Report for October. The consensus is for an increase of 120,000 non-farm payroll jobs in October; there were 114,000 jobs added in September.
The consensus is for the unemployment rate to increase to 7.9% in October, up from 7.8% in September.
This second employment graph shows the percentage of payroll jobs lost during post WWII recessions through September.
 The economy has added 5.2 million private sector jobs since employment bottomed in February 2010 including preliminary benchmark revision (4.6 million total jobs added including all the public sector layoffs).
There are still 3.7 million fewer private sector jobs now than when the recession started in 2007 (including benchmark revision).
10:00 AM: Manufacturers' Shipments, Inventories and Orders (Factory Orders) for September. The consensus is for a 4.0% decrease in orders.


