by Calculated Risk on 11/21/2012 04:52:00 PM
Wednesday, November 21, 2012
DOT: Vehicle Miles Driven decreased 1.5% in September
I first started tracking monthly vehicle miles to see the impact of the recession on driving. Since then we've seen the impact of demographics and changing preferences ... very interesting.
The Department of Transportation (DOT) reported today:
Travel on all roads and streets changed by -1.5% (-3.6 billion vehicle miles) for September 2012 as compared with September 2011. ◦Travel for the month is estimated to be 237.1 billion vehicle miles.The following graph shows the rolling 12 month total vehicle miles driven.
Cumulative Travel for 2012 changed by 0.6% (14.2 billion vehicle miles).
The rolling 12 month total is still mostly moving sideways.
 Click on graph for larger image.
In the early '80s, miles driven (rolling 12 months) stayed below the previous peak for 39 months.
Currently miles driven has been below the previous peak for 58 months - and still counting.
The second graph shows the year-over-year change from the same month in the previous year.
 Gasoline prices were up in September compared to September 2011. In September 2012, gasoline averaged of $3.91 per gallon according to the EIA. Last year, prices in September averaged $3.67 per gallon, so - just looking at gasoline prices - it is no surprise that miles driven decreased year-over-year in September.
Just looking at gasoline prices suggest miles driven will be down again in October - especially with the very high prices in California. Nationally gasoline prices averaged $3.81 in October, up sharply from $3.51 a year ago.
However, as I've mentioned before, gasoline prices are just part of the story. The lack of growth in miles driven over the last 5 years is probably also due to the lingering effects of the great recession (high unemployment rate and lack of wage growth), the aging of the overall population (over 55 drivers drive fewer miles) and changing driving habits of young drivers.
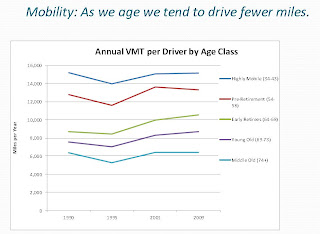
 This graph from the Federal Highway Administration is based on the National Household Travel Survey shows the miles driven by certain age groups over time. The key is a large group is moving into the older age brackets, so their miles driven will decline - a large group is moving the from the "54 to 58" age group into the higher age groups.
Also miles driven has been falling for lower age groups over the last few years, and the next survey will probably show that decline. Here is an article on younger drivers: Young People Are Driving Less—And Not Just Because They're Broke (ht KarmaPolice)
An April study by the U.S. Public Interest Research Group found that between 2001 and 2009 the average annual vehicle miles traveled by Americans ages 16 to 34 fell by close to a quarter, from 10,300 to 7,900 per capita (four times greater than the drop among all adults), and from 12,800 to 10,700 among those with jobs.With all these factors, it may be years before we see a new peak in miles driven.
...
The PIRG researchers concluded that this change couldn’t simply be pegged to the economy, but indicates a value shift.


