by Calculated Risk on 11/19/2012 06:40:00 PM
Monday, November 19, 2012
Existing Home Sales: The Increase in Conventional Sales
Earlier I pointed out that one the keys for housing to return to "normal" are more conventional sales and fewer distressed sales. Not all areas report the percentage of distressed sales, and the NAR uses an unscientific survey to estimate distressed sales.
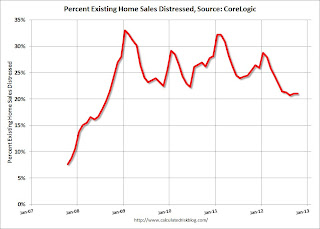
CoreLogic estimates the percent of distressed sales each month, and they were kind enough to send me their series. The first graph below shows CoreLogic's estimate of the distressed share starting in October 2007.
 Click on graph for larger image.
Note that the percent distressed increases every winter. This is because distressed sales happen all year, and conventional sales follow the normal seasonal pattern of stronger in the spring and summer, and weaker in the winter.
This is why the Case-Shiller seasonal adjustment increased in recent years.
Also note that the percent of distressed sales over the last 5 months is at the lowest level since mid-2008, but still very high.
The second graph shows the NAR existing home series using the CoreLogic share of distressed sales.
 If we just look at conventional sales (blue), sales declined from over 7 million in 2005 (graph starts in 2007) to a low of under 2.5 million.
Using this method (NAR estimate for sales, CoreLogic estimate of share), conventional sales are now back up to around 3.8 million SAAR. The NAR reported total sales were up 10.9% year-over-year in October, but using this method, conventional sales were up almost 18% year-over-year.
Earlier:
• Existing Home Sales in October: 4.79 million SAAR, 5.4 months of supply
• Existing Home Sales: A Solid Report
• Existing Home Sales graphs


