by Calculated Risk on 1/10/2013 01:30:00 PM
Thursday, January 10, 2013
Question #2 for 2013: Will the U.S. economy grow in 2013?
Note: Sometimes it is useful to jot down a few thoughts on how the economy is expected to perform. This isn't to test my forecasting skills; sometimes I learn more when I get something wrong!
Some years I make some big out-of-consensus calls, but my forecasts this year are mostly in line with the consensus.
Earlier I posted some questions for this year: Ten Economic Questions for 2013. I'll try to add some thoughts, and maybe some predictions for each question.
Note: Here is a review of my 2012 Forecasts
2) Economic growth: Heading into 2013 there are still significant downside risks from the European financial crisis and from U.S. fiscal policy. Will the U.S. economy grow in 2013? Or will there be another recession?
There are several positives for the economy at the beginning of 2013: residential investment is picking up (usually the best leading indicator for the economy), the state and local government layoffs and cutbacks appear to be ending, and a substantial amount of household deleveraging has already happened.
Here are a couple of graph on household debt (and debt service):

This graph from the the NY Fed shows aggregate consumer debt decreased in Q3. This was mostly due to a decline in mortgage debt.
Household debt peaked in Q2 2008 and has been declining for over four years. There is probably more deleveraging ahead (mostly from foreclosures and distressed sales), but this suggests some improvement in household balance sheets.
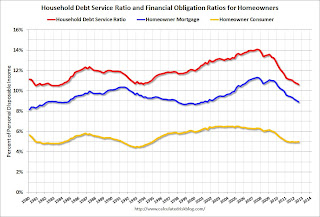
 The second graph is from the Fed's Household Debt Service and Financial Obligations Ratios. These ratios show the percent of disposable personal income (DPI) dedicated to debt service (DSR) and financial obligations (FOR) for households.
The graph shows the DSR for both renters and homeowners (red), and the homeowner financial obligations ratio for mortgages and consumer debt. The overall Debt Service Ratio has declined back to early 1980s levels, and is near the record low - thanks to very low interest rates. The homeowner's financial obligation ratio for consumer debt is at 1994 levels.
The blue line is the homeowner's financial obligation ratio for mortgages (blue). This ratio increased rapidly during the housing bubble, and continued to increase until 2008. Now, with falling interest rates, and less mortgage debt (mostly due to foreclosures), the ratio is back to 2001 levels. This will probably decline further, but for many homeowners, the obligation ratio is low.
There are always downside risks from Europe and China, but usually with these positive trends I'd expect a pickup in US growth in 2013. However, the recent austerity (aka "fiscal cliff") - especially the payroll tax increase compared to 2012 - will be a drag on economic growth this year.
 Here is a graph showing the rolling real GDP growth (over 4 quarters) since 2000 through Q3 2012. The rolling four quarter graph smooths out the quarterly up and downs, and show that the US economy has been growing at a little over 2% for the last few years.
We still don't know the size of the "sequester", but right now it appears the drag from austerity will probably offset the pickup in the private sector - and we can expect another year of sluggish growth in 2013 probably in the 2% range again.
Here are the ten questions for 2013 and a few predictions:
• Question #1 for 2013: US Fiscal Policy
• Question #2 for 2013: Will the U.S. economy grow in 2013?
• Question #3 for 2013: How many payroll jobs will be added in 2013?
• Question #4 for 2013: What will the unemployment rate be in December 2013?
• Question #5 for 2013: Will the inflation rate rise or fall in 2013?
• Question #6 for 2013: What will happen with Monetary Policy and QE3?
• Question #7 for 2013: What will happen with house prices in 2013?
• Question #8 for 2013: Will Housing inventory bottom in 2013?
• Question #9 for 2013: How much will Residential Investment increase?
• Question #10 for 2013: Europe and the Euro


