by Calculated Risk on 6/25/2013 12:10:00 PM
Tuesday, June 25, 2013
A few comments on House Prices and New Home Sales
First on house prices, Zillow's chief economist Stan Humphries wrote this morning:
“Today’s Case-Shiller numbers may reflect where the housing market has been in some of the frothier metros, but they are not indicative of where it’s headed. The housing market worm has turned over the past few weeks – inventory levels are beginning to show signs of easing, and mortgage interest rates are creeping up. Going forward, both of these factors will help mitigate extreme price spikes caused by very strong housing demand and very low housing supply,” said Zillow Chief Economist Dr. Stan Humphries. “Runaway appreciation in many of the large, coastal metros that form the backbone of the Case-Shiller indices will begin to moderate. Home value appreciation in some of these areas will have to slow down, or potentially fall, as higher bottom-line prices are no longer masked by rock-bottom mortgage rates. In general, the national housing recovery is strong and sustainable, but pockets of volatility will emerge as local fundamentals shift. Buyers expecting home values to continue rising at this pace indefinitely may be in for a shock.”I agree with Humphries view on prices. I've been tracking inventory weekly, and it appears inventory levels are starting to increase (even after seasonal adjustment). Also I've heard reports from several real estate agents that the market has "slowed" (fewer multiple offer situations), even before mortgage rates increased. I also think Humphries is correct that this will slow down price increases going forward.
emphasis added
However I don't think this will impact the ongoing recovery in residential investment (housing starts and new home sales). The new home sales report this morning was solid with sales above expectations and significant upward revisions to prior months. The key points right now are that sales are increasing and will probably continue to increase for some time.
Now that we have five months of data for 2013, one way to look at the growth rate is to use the "not seasonally adjusted" (NSA) year-to-date data. According to the Census Bureau, there were 202 thousand new homes sold in 2013 through May, up about 29% from the 156 thousand sold during the same period in 2012. That is a very solid increase in sales, and this was the highest sales for these months since 2008.
Note: For 2013, estimates are sales will increase to around 450 to 460 thousand, or an increase of around 22% to 25% on an annual basis from the 369 thousand in 2012.
Although there has been a large increase in the sales rate, sales are just above the lows for previous recessions. This suggests significant upside over the next few years. Based on estimates of household formation and demographics, I expect sales to increase to 750 to 800 thousand over the next several years - substantially higher than the current sales rate.
And an important point worth repeating every month: Housing is historically the best leading indicator for the economy, and this is one of the reasons I think The future's so bright, I gotta wear shades.
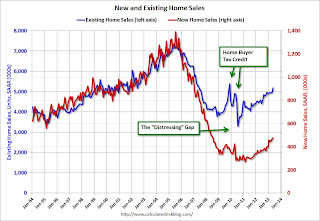
And here is another update to the "distressing gap" graph that I first started posting over four years ago to show the emerging gap caused by distressed sales. Now I'm looking for the gap to start to close over the next few years.
 Click on graph for larger image.
The "distressing gap" graph shows existing home sales (left axis) and new home sales (right axis) through May 2013. This graph starts in 1994, but the relationship has been fairly steady back to the '60s.
Following the housing bubble and bust, the "distressing gap" appeared mostly because of distressed sales. The flood of distressed sales kept existing home sales elevated, and depressed new home sales since builders weren't able to compete with the low prices of all the foreclosed properties.
I don't expect much of an increase in existing home sales (distressed sales will slowly decline and be offset by more conventional sales). But I do expect this gap to continue to close - mostly from an increase in new home sales.
 Another way to look at this is a ratio of existing to new home sales.
This ratio was fairly stable from 1994 through 2006, and then the flood of distressed sales kept the number of existing home sales elevated and depressed new home sales. (Note: This ratio was fairly stable back to the early '70s, but I only have annual data for the earlier years).
In general the ratio has been trending down, and I expect this ratio to trend down over the next several years as the number of distressed sales declines and new home sales increase.
Note: Existing home sales are counted when transactions are closed, and new home sales are counted when contracts are signed. So the timing of sales is different.


