by Calculated Risk on 9/27/2013 12:09:00 PM
Friday, September 27, 2013
Chemical Activity Barometer for September Suggests Economic Activity Increasing
This is a new indicator that I'm following that appears to be a leading indicator for the economy.
From the American Chemistry Council: Leading Economic Indicator at Highest Since June 2008; Hints at Potential Upside Surprises for U.S. Economy
The U.S. economy continues to improve, with forecasts now suggesting economic expansion into 2015, according to the American Chemistry Council’s (ACC) monthly Chemical Activity Barometer (CAB), released today. The Chemical Activity Barometer is a leading economic indicator, shown to lead U.S. business cycles by an average of eight months at cycle peaks, and four months at cycle troughs. The barometer increased 0.4 percent over August on a three-month moving average (3MMA) basis. The barometer is up 3.3 percent over a year ago, with the index itself at its highest point since June 2008. Prior CAB readings for April through August were all revised.
“This 0.4 percent jump is a real improvement in growth dynamics from the smaller, yet steady, increases we saw from March through August,” said Dr. Kevin Swift, chief economist at the American Chemistry Council. “The Chemical Activity Barometer is showing a strengthening of some fundamentals, with forecasts remaining positive. Indeed, there is potential for upside surprises in the U.S. economy,” he added.
emphasis added
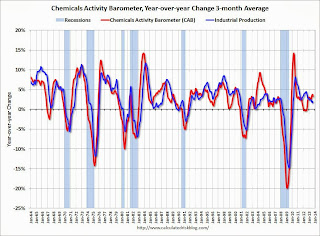
 Click on graph for larger image.
This graph shows the year-over-year change in the 3-month moving average for the Chemical Activity Barometer compared to Industrial Production. It does appear that CAB (red) generally leads Industrial Production (blue).
And this suggests that economic activity is increasing.


