by Calculated Risk on 10/20/2013 07:04:00 PM
Sunday, October 20, 2013
Builder Confidence and Single Family Starts
Last week the National Association of Home Builders (NAHB) reported the housing market index (HMI) declined in October to 55 from 57 in September.
Here is the press release from the NAHB: Builder Confidence Down in October; NAHB Estimates Sept. Housing Starts will Approach 900,000 Units
For some time I've been posting a graph with both builder confidence and single family starts (first graph below). This chart shows that confidence and single family starts generally move in the same direction, but it doesn't tell us anything about the expected level of single family starts.
 Click on graph for larger image.
This graph compares the NAHB HMI (left scale) with single family housing starts (right scale). This includes the October release for the HMI and the August data for starts.
Builder confidence is based on a survey by the NAHB, and is designed so that any number above 50 indicates that more builders view sales conditions as good than poor. Since sales have picked up, builders are now more confident - and the surviving builders view sales as "good" - even though single family starts are still historically very low.
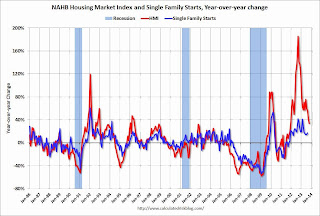
 Probably a better comparison is to look at the year-over-year change in each series (Builder confidence and single family housing starts).
Once again the year-over-year change tends to move in the same direction, but builder confidence has larger swings (especially lately).
I expect single family starts to continue to increase over the next few years, but I don't think we should builder confidence to estimate the eventual level.


