by Calculated Risk on 10/18/2013 01:22:00 PM
Friday, October 18, 2013
CoStar: Commercial Real Estate prices mostly flat in August, Up 9% Year-over-year
Here is a price index for commercial real estate that I follow.
From CoStar: Commercial Real Estate Pricing Growth Levels Off in August Amid Uncertainty over Fed Tapering and Rising Interest Rates
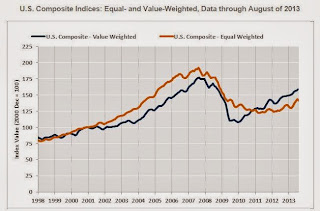
PRICING GROWTH FOR COMMERCIAL PROPERTY SLOWED IN AUGUST AMID ANXIETY OVER FED’S TAPERING OF BOND PURCHASES AND RISE IN INTEREST RATES: The two broadest measures of aggregate pricing for commercial properties within the CCRSI—the value-weighted and the equal-weighted versions of the U.S. Composite Index—saw mixed movements for the month. The equal-weighted index, which reflects the pricing impact of more numerous smaller transactions, edged downward by 1.1% in August, while the value-weighted index, which is influenced by larger transactions, expanded by 1.6% during the same time period. On an annual basis, both indices advanced by nearly 10%. Despite investor reassurance following the Fed’s decision in September to delay the tapering of its quantitative easing policies, further economic uncertainty, largely stemming from the U.S. government shutdown and debt ceiling debate, may lead to further volatility in pricing in the near term.
POSITIVE ABSORPTION IN BOTH INVESTMENT GRADE AND GENERAL COMMERCIAL SEGMENTS SUPPORTS BROAD PRICING RECOVERY: Net absorption of available space across the three major commercial property types – office, retail and warehouse – continues to improve. For the first three quarters of 2013 net absorption among these three property types totaled more than 240 million square feet, the highest level for the first three quarters of a year since 2008. ...
TRANSACTION VOLUME REMAINS STEADY: The number of repeat sale transactions through August 2013 increased 15% from the same period one year ago, while the value of those transactions increased 17%. The percentage of commercial property selling at distressed prices remains near a four-and-a-half year low.
emphasis added
 Click on graph for larger image.
This graph from CoStar shows the Value-Weighted and Equal-Weighted indexes. CoStar reported that the Value-Weighted index is up 47.5% from the bottom (showing the earlier and stronger demand for higher end properties) and up 9.0% year-over-year. However the Equal-Weighted index is only up 15.7% from the bottom, and up 10.0% year-over-year.
Note: These are repeat sales indexes - like Case-Shiller for residential - but this is based on far fewer pairs.


