by Calculated Risk on 11/24/2013 01:29:00 PM
Sunday, November 24, 2013
Housing Starts and Permits
The Census Bureau has announced that the housing starts releases for September and October will be delayed until December 18th, but that housing permits for September and October will be released this coming Tuesday.
The good news is housing starts and permits mostly move together. "Housing starts" are an estimate for the entire country, and "permits" are only for areas requiring building permits. From the Census Bureau:
Housing starts and completions estimates cover the entire United States, not just areas requiring building permits. The number of housing units built in non-permit areas is about 2.5 percent of the total. Nearly all are single-family houses. (Note that the number of jurisdictions (or "places") requiring building permits increases over time as non-permit places become permit-issuing. The Census Bureau's universe of permit offices was increased in 2005 from 19,000 to 20,000 places.)
 Click on graph for larger image.
The first graph shows total housing starts and permits since January 2008.
Over time, more areas have required permits, and now permits and starts mostly move together.
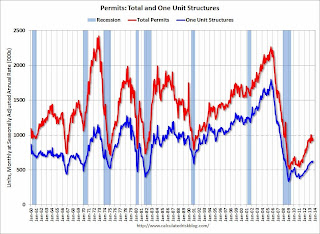
The second graph shows total and single unit permits since 1960. This is the graph I'll post on Tuesday when permits are released.
 This shows the huge collapse following the housing bubble, and that housing permits have been generally increasing after moving sideways for about two years and a half years.
 Since housing starts will be delayed, there will be an extra focus on permits on Tuesday - especially since some of the homebuilders have posted weak results recently.


