by Calculated Risk on 2/17/2014 06:44:00 PM
Monday, February 17, 2014
Weekly Update: Housing Tracker Existing Home Inventory up 6.6% year-over-year on Feb 17th
Here is another weekly update on housing inventory ...
There is a clear seasonal pattern for inventory, with the low point for inventory in late December or early January, and then usually peaking in mid-to-late summer.
The Realtor (NAR) data is monthly and released with a lag (the most recent data was for December). However Ben at Housing Tracker (Department of Numbers) has provided me some weekly inventory data for the last several years.
 Click on graph for larger image.
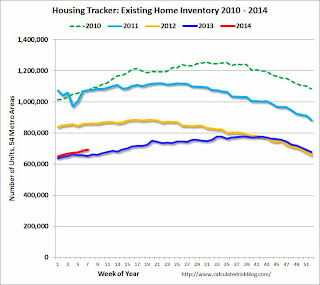
This graph shows the Housing Tracker reported weekly inventory for the 54 metro areas for 2010, 2011, 2012, 2013 and 2014.
In 2011 and 2012, inventory only increased slightly early in the year and then declined significantly through the end of each year.
Inventory in 2014 is now 6.6% above the same week in 2013 (red is 2014, blue is 2013).
Inventory is still very low, but this increase in inventory should slow house price increases.
Note: One of the key questions for 2014 will be: How much will inventory increase? My guess is inventory will be up 10% to 15% year-over-year by the end of 2014 (inventory would still be below normal).


