by Calculated Risk on 3/25/2014 01:51:00 PM
Tuesday, March 25, 2014
Comment on House Prices: Graphs, Real Prices, Price-to-Rent Ratio, Cities
S&P/Case-Shiller's website crashed this morning. For some reason people seem to care about house prices!
Here is the website and the monthly Home Price Indices for January ("January" is a 3 month average of November, December and January prices). This release includes prices for 20 individual cities, and two composite indices (for 10 cities and 20 cities).
Note: Case-Shiller reports Not Seasonally Adjusted (NSA), I use the SA data for the graphs.
Here is the press release from S&P: Pace of Home Price Gains Slow According to the S&P/Case-Shiller Home Price Indices
 Click on graph for larger image.
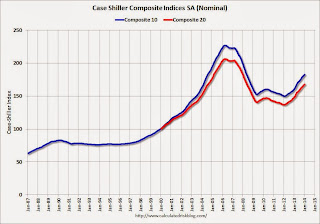
The first graph shows the nominal seasonally adjusted Composite 10 and Composite 20 indices (the Composite 20 was started in January 2000).
The Composite 10 index is off 19.5% from the peak, and up 0.8% in January (SA). The Composite 10 is up 21.9% from the post bubble low set in Jan 2012 (SA).
The Composite 20 index is off 18.7% from the peak, and up 0.8% (SA) in January. The Composite 20 is up 22.6% from the post-bubble low set in Jan 2012 (SA).
 The second graph shows the Year over year change in both indices.
The Composite 10 SA is up 13.5% compared to January 2013.
The Composite 20 SA is up 13.2% compared to January 2013.
Prices increased (SA) in 20 of the 20 Case-Shiller cities in January seasonally adjusted. (Prices increased in 7 of the 20 cities NSA) Prices in Las Vegas are off 44.8% from the peak, and prices in Dallas and Denver are at new highs (SA).
This was at the consensus forecast for a 13.3% YoY increase.
I've been hearing reports of a slowdown in house price increases (more than the usual seasonal slowdown), and perhaps this slowdown in price increases is finally showing up in the Case-Shiller index. This makes sense since inventory is starting to increase.
According to Trulia chief economist Jed Kolko, asking price increases have slowed down recently, and Kolko expects that price slowdown will "hit Feb sales prices and get reported in April index releases".
It might take a few months, but I also expect to see smaller year-over-year price increases going forward.
I also think it is important to look at prices in real terms (inflation adjusted). Case-Shiller, CoreLogic and others report nominal house prices. As an example, if a house price was $200,000 in January 2000, the price would be close to $276,000 today adjusted for inflation (about 38%). That is why the second graph below is important - this shows "real" prices (adjusted for inflation).
Nominal House Prices
 The first graph shows the quarterly Case-Shiller National Index SA (through Q4 2013), and the monthly Case-Shiller Composite 20 SA and CoreLogic House Price Indexes (through January) in nominal terms as reported.
In nominal terms, the Case-Shiller National index (SA) is back to Q1 2004 levels (and also back up to Q3 2008), and the Case-Shiller Composite 20 Index (SA) is back to Oct 2004 levels, and the CoreLogic index (NSA) is back to August 2004.
Real House Prices
 The second graph shows the same three indexes in real terms (adjusted for inflation using CPI less Shelter). Note: some people use other inflation measures to adjust for real prices.
In real terms, the National index is back to Q2 2001 levels, the Composite 20 index is back to June 2002, and the CoreLogic index back to May 2002.
In real terms, house prices are back to early '00s levels.
Price-to-Rent
In October 2004, Fed economist John Krainer and researcher Chishen Wei wrote a Fed letter on price to rent ratios: House Prices and Fundamental Value. Kainer and Wei presented a price-to-rent ratio using the OFHEO house price index and the Owners' Equivalent Rent (OER) from the BLS.
 Here is a similar graph using the Case-Shiller National, Composite 20 and CoreLogic House Price Indexes.
This graph shows the price to rent ratio (January 1998 = 1.0).
On a price-to-rent basis, the Case-Shiller National index is back to Q2 2001 levels, the Composite 20 index is back to Sept 2002 levels, and the CoreLogic index is back to Dec 2002.
In real terms - and as a price-to-rent ratio - prices are mostly back to early 2000 levels.


