by Calculated Risk on 6/24/2014 01:39:00 PM
Tuesday, June 24, 2014
Comments on Housing and the New Home Sales report
In early May I wrote: What's Right with Housing? I concluded with "Housing is a slow moving market - and the recovery will not be smooth or fast with all the residual problems. But overall housing is clearly improving and the outlook remains positive for the next few years."
Here are a few positive updates:
1) Existing home sales were down 5.0% year-over-year in May. This is good news because the decline is due to fewer foreclosures and short sales.
2) Mortgage delinquencies are down sharply. See: Black Knight: Mortgage Loans in Foreclosure Process Lowest since July 2008 and Fannie Mae and Freddie Mac: Mortgage Serious Delinquency rate declined in April
3) The impact from rising mortgage rates is mostly behind us. In fact, mortgage rates are now down year-over-year. On June 23, 2013, 30 year mortgage rates were at 4.49%. On June 23, 2014, 30 year fixed rates were at 4.18%.
4) Existing home inventory is increasing, and house price increases are slowing. Sometimes rising inventory is a sign of trouble (I was pointing to this in 2005), but now inventory is so low that it is a positive that inventory is increasing. This will also slow house price increases (I think that will be a positive for housing too - a more normal market).
Overall the housing recovery is ongoing and should continue.
Also this morning the Census Bureau reported that new home sales were at a seasonally adjusted annual rate (SAAR) of 504 thousand in May. That is the highest level since May 2008. As usual, I don't read too much into any one report. In fact, through May this year, sales were 196,000, Not seasonally adjusted (NSA) - only up 2% compared to the same period in 2013 - not much of an increase.
This was a disappointing start to the year, probably mostly due to higher mortgage rates and higher prices. Also there were probably supply constraints in some areas and credit remains difficult for many potential borrowers.
Also early 2013 was a difficult comparison period. Annual sales in 2013 were up 16.3% from 2012, but sales in the first five months of 2013 were up 23% from the same period in 2012!
 Click on graph for larger image.
This graph shows new home sales for 2013 and 2014 by month (Seasonally Adjusted Annual Rate).
The comparisons to last year will be a little easier starting in July, and I still expect to see solid year-over-year growth later this year.
And here is another update to the "distressing gap" graph that I first started posting several years ago to show the emerging gap caused by distressed sales. Now I'm looking for the gap to close over the next few years.
 The "distressing gap" graph shows existing home sales (left axis) and new home sales (right axis) through May 2014. This graph starts in 1994, but the relationship has been fairly steady back to the '60s.
Following the housing bubble and bust, the "distressing gap" appeared mostly because of distressed sales.
I expect existing home sales to mostly move sideways (distressed sales will slowly decline and be offset by more conventional / equity sales). And I expect this gap to slowly close, mostly from an increase in new home sales.
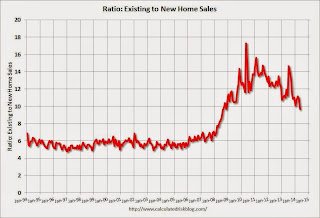
 Another way to look at this is a ratio of existing to new home sales.
This ratio was fairly stable from 1994 through 2006, and then the flood of distressed sales kept the number of existing home sales elevated and depressed new home sales. (Note: This ratio was fairly stable back to the early '70s, but I only have annual data for the earlier years).
In general the ratio has been trending down - and is currently at the lowest level since November 2008. I expect this ratio to continue to trend down over the next several years as the number of distressed sales declines and new home sales increase.
Note: Existing home sales are counted when transactions are closed, and new home sales are counted when contracts are signed. So the timing of sales is different.


