by Calculated Risk on 8/11/2014 01:15:00 PM
Monday, August 11, 2014
Kolko: "Let’s Improve, Not Ignore, Seasonal Adjustment of Housing Data"
CR Note: This is from Trulia chief economist Jed Kolko: Let’s Improve, Not Ignore, Seasonal Adjustment of Housing Data
The housing crisis substantially changed the seasonal pattern of housing activity: relative to conventional home sales, which peak in summer, distressed home sales are more evenly spread throughout the year and sell at a discount. As a result, in years when distressed sales constitute a larger share of overall sales, the seasonal swings in home prices get bigger while the seasonal swings in sales volumes get smaller.
Sharply changing seasonal patterns create problems for seasonal adjustment methods, which typically estimate seasonal adjustment factors by averaging several years’ worth of observed seasonal patterns. A sharp but ultimately temporary change in the seasonal pattern for housing activity affects seasonal adjustment factors more gradually and for more years than it should. Despite the recent normalizing of the housing market, seasonal adjustment factors are still based, in part, on patterns observed at the height of the foreclosure crisis, causing home price indices to be over-adjusted in some months and under-adjusted in others.
Unfortunately, many have concluded that the solution to the problem of changing seasonal patterns is to downplay or ignore seasonally adjusted housing data until the foreclosure crisis is far enough in the past that it is no longer averaged into seasonal adjustment factors. Standard and Poor’s, publishers of the Case-Shiller home-price index, themselves warned in 2010 that “the unadjusted series is a more reliable indicator and, thus, reports should focus on the year-over-year changes where seasonal shifts are not a factor. Additionally, if monthly changes are considered, the unadjusted series should be used.” Even today, Case-Shiller home-price index press releases continue to emphasize non-seasonally-adjusted (NSA) changes over seasonally adjusted (SA) changes.
But ignoring seasonality during and after the foreclosure crisis is the opposite of what we should be doing. Changing seasonal patterns make seasonal adjustment more important. Because the foreclosure crisis caused seasonal swings in home prices to increase, NSA data were even less reflective of the true underlying trend than in normal times. Furthermore, when the true seasonal pattern is shifting, seasonality affects year-over-year changes (y/y), not just month-over-month (m/m) and other intra-year changes. Y/y changes are immune from seasonality concerns only if the true seasonal effect is the same for a given month in successive years.
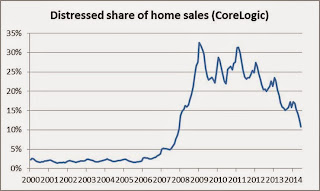
The solution is to develop better seasonal adjustment factors (SAFs). If distressed sales account for the change in seasonal patterns, then the shift in SAFs over these years should reflect the timing and magnitude of the distressed sales share. CoreLogic data show that the distressed share (REO plus short sales) of home sales rose sharply around 2008 and since then have fallen more than halfway back to normal:

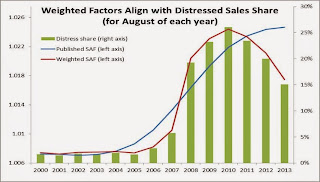
The SAFs for the Case-Shiller index became more extreme between the pre-crisis years of the early 2000s and the height of the foreclosure crisis. However, the Case-Shiller SAFs increased in amplitude much more gradually than the spike in the distressed sales share, and in 2014 the SAFs remain near their most extreme levels despite the drop in distressed share.

So, consider this simple adjustment: for each calendar month, treat the average Case-Shiller SAFs prior to the increase in amplitude (roughly 2004 and earlier) as the norm for that month, and treat the most extreme SAF for that month over the whole time period as an accurate reflection of the seasonal pattern when the distressed sales share peaked. Then, using this set of normal and extreme SAFs, calculate the “weighted seasonal adjustment factor” (WSAF) as the average of the normal and extreme SAF for each month, weighed by how the actual share of distressed sales compared with the extreme and normal share of distressed sales for that month. The resulting WSAFs look like this:

The WSAF series closely reflects timing of the rise and fall in distressed sales share, while the Case-Shiller SAF series changes much more slowly, as is clear from looking at the distressed share, the SAFs, and WSAFs for every August since 2000:

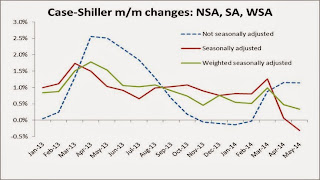
Applying these WSAFs to the unadjusted Case-Shiller 20-city index yields a weighted seasonally adjusted (WSA) index. We can compare the published NSA and SA price changes with the WSA price changes that reflect this alternative seasonal adjustment method. While the m/m SA change for May was -0.3%, the m/m WSA change was +0.3%. Here are NSA, SA, and WSA m/m changes since January 2013:

The WSA changes show that there has been a gradual slowdown in home price gains, but prices are still increasing. WSA price changes offer no evidence that the housing recovery has gone into reverse, even though the SA index showed prices essentially flat in April and falling in May.
Finally: what do these WSAFs tell us about the value of seasonal adjustment? Two things. First: even though the published SA series is based on factors that don’t reflect the time-pattern of the foreclosure crisis perfectly, the published SA changes and the WSA changes look more similar to each other than either does to the NSA changes. If the WSA is a correct approach, then even the flawed published SA home price changes come a lot closer to the true m/m seasonally adjusted trend than the NSA price changes do. In other words, we should not ignore seasonal adjustment and rely on NSA m/m changes.
Second: when seasonal patterns are changing sharply, seasonality can affect y/y changes, too, not just intra-year changes. In March 2014, for instance, the NSA and SA y/y price increases for the Case-Shiller 20-city index were both 12.4%, but the WSA y/y price increase was 12.0%. The WSA y/y change is lower because it properly uses a more modest upward seasonal adjustment for March 2014 than for March 2013, but the published SAFs changed little between March 2013 and March 2014, and of course the NSA y/y change assumes that the seasonal factors in successive Marches are identical and cancel each other out. In other months, though, such as May 2014, the WSA y/y change is quite similar to the NSA and SA y/y changes.
The solution to changing seasonal patterns, therefore, is to develop better seasonal adjustment factors, not to ignore seasonality. Using flawed seasonal adjustment factors – or, worse, relying on non-seasonally-adjusted data – clouds our view of the housing recovery, both today and for several years to come.


