by Calculated Risk on 3/31/2015 09:15:00 AM
Tuesday, March 31, 2015
Case-Shiller: National House Price Index increased 4.5% year-over-year in January
S&P/Case-Shiller released the monthly Home Price Indices for January ("January" is a 3 month average of November, December and January prices).
This release includes prices for 20 individual cities, two composite indices (for 10 cities and 20 cities) and the monthly National index.
Note: Case-Shiller reports Not Seasonally Adjusted (NSA), I use the SA data for the graphs.
From S&P: Rise in Home Prices Paced by Denver, Miami, and Dallas According to the S&P/Case-Shiller Home Price Indices
Data released today for January 2015 show that home prices continued their rise across the country over the last 12 months. However, monthly data reveal slowing increases and seasonal weakness. ... Both the 10-City and 20-City Composites saw year-over-year increases in January compared to December. The 10-City Composite gained 4.4% year-over-year, up from 4.3% in December. The 20-City Composite gained 4.6% year-over-year, compared to a 4.4% increase in December. The S&P/Case-Shiller U.S. National Home Price Index, which covers all nine U.S. census divisions, recorded a 4.5% annual gain in January 2015 versus a 4.6% increase in December 2014.
...
The National index declined for the fifth consecutive month in January, reporting a -0.1% change for the month. Both the 10- and 20-City Composites reported virtually flat month-over-month changes. Of the nine cities that reported increases, Charlotte, Miami, and San Diego led all cities in January with increases of 0.7%. San Francisco reported the largest decrease of all 20 cities, with a month over-month decrease of -0.9%. Seattle and Washington D.C. reported decreases of -0.5%. U
...
“The combination of low interest rates and strong consumer confidence based on solid job growth, cheap oil and low inflation continue to support further increases in home prices” says David M. Blitzer, Managing Director and Chairman of the Index Committee for S&P Dow Jones Indices. “Regional patterns in recent months continue: strength in the west and southwest paced by Denver and Dallas with results ahead of the national index in the California cities, the Pacific Northwest and Las Vegas. The northeast and Midwest are mostly weaker than the national index.
 Click on graph for larger image.
 The first graph shows the nominal seasonally adjusted Composite 10, Composite 20 and National indices (the Composite 20 was started in January 2000).
The Composite 10 index is off 15.9% from the peak, and up 0.9% in January (SA).
The Composite 20 index is off 14.9% from the peak, and up 0.9% (SA) in January.
The National index is off 7.9% from the peak, and up 0.5% (SA) in January. The National index is up 24.3% from the post-bubble low set in Dec 2011 (SA).
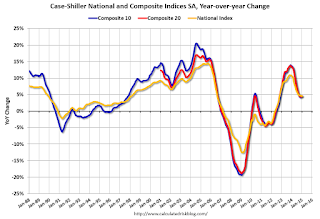
 The second graph shows the Year over year change in all three indices.
The Composite 10 SA is up 4.4% compared to January 2014.
The Composite 20 SA is up 4.6% year-over-year..
The National index SA is up 4.5% year-over-year.
Prices increased (SA) in all 20 of the 20 Case-Shiller cities in January seasonally adjusted. (Prices increased in 9 of the 20 cities NSA) Prices in Las Vegas are off 41.4% from the peak, and prices in Denver and Dallas are at new highs (SA).
This was close to the consensus forecast for a 4.6% YoY increase for the National index. I'll have more on house prices later.


