by Calculated Risk on 4/05/2016 09:02:00 AM
Tuesday, April 05, 2016
CoreLogic: House Prices up 6.8% Year-over-year in February
Notes: This CoreLogic House Price Index report is for February. The recent Case-Shiller index release was for January. The CoreLogic HPI is a three month weighted average and is not seasonally adjusted (NSA).
From CoreLogic: CoreLogic US Home Price Report Shows Home Prices Up 6.8 Percent Year Over Year in February 2016
Home prices nationwide, including distressed sales, increased year over year by 6.8 percent in February 2016 compared with February 2015 and increased month over month by 1.1 percent in February 2016 compared with January 2016, according to the CoreLogic HPI.
...
“Fixed-rate mortgage rates dropped more than one-quarter of a percentage point in the first three months of 2016, and job creation averaged 209,000 over the same period,” said Dr. Frank Nothaft, chief economist for CoreLogic. “These economic forces will sustain home purchases during the spring and support the 5.2 percent home price appreciation CoreLogic has projected for the next year.”
emphasis added
 Click on graph for larger image.
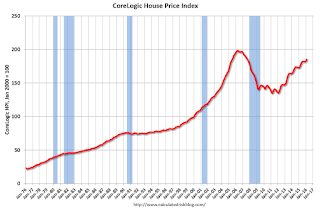
 This graph shows the national CoreLogic HPI data since 1976. January 2000 = 100.
The index was up 1.1% in February (NSA), and is up 6.8% over the last year.
This index is not seasonally adjusted, and this was a solid month-to-month increase.
The index is still 6.5% below the bubble peak in nominal terms (not inflation adjusted).
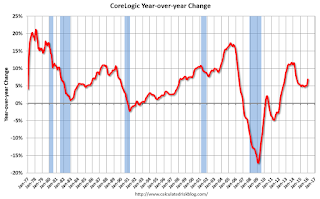
 The second graph shows the YoY change in nominal terms (not adjusted for inflation).
The YoY increase had been moving sideways over the last year, but has picked up a recently.
The year-over-year comparison has been positive for forty eight consecutive months.


