 RSS Feed
 by Calculated Risk on 10/31/2016 06:23:00 PM
Monday, October 31, 2016
Tuesday: ISM Mfg, Construction Spending, Vehicle Sales
From Matthew Graham at Mortgage News Daily: Mortgage Rates End October Just Off 5-Month Highs
Mortgage Rates moved sideways to slightly lower for the 2nd day in a row, after hitting the highest levels in 5 months on Thursday. While the positive progress is better than a sharp stick in the eye, it nonetheless leaves us right in line with highs for all practical purposes. In fact, virtually all lenders are putting out quotes today that are indistinguishable from Thursday's for most prospective borrowers. The most prevalently-quoted conventional 30yr fixed rate remains 3.625% on top tier scenarios, with a handful of the most aggressive lenders at 3.5%.Tuesday:
emphasis added
• At 10:00 AM ET, ISM Manufacturing Index for October. The consensus is for the ISM to be at 51.6, up from 51.5 in September. The ISM manufacturing index indicated expansion at 51.5% in September. The employment index was at 49.7%, and the new orders index was at 55.1%.
• At 10:00 AM, Construction Spending for September. The consensus is for a 0.6% increase in construction spending.
• All day: Light vehicle sales for October. The consensus is for light vehicle sales to decrease to 17.6 million SAAR in October, from 17.7 million in September (Seasonally Adjusted Annual Rate).
Q3 2016 GDP Details on Residential and Commercial Real Estate
by Calculated Risk on 10/31/2016 01:41:00 PM
The BEA has released the underlying details for the Q3 advance GDP report this morning.
The BEA reported that investment in non-residential structures increased at a 5.4% annual pace in Q3. This is a turnaround from recent quarters when non-residential investment declined due to less investment in petroleum exploration. Investment in petroleum and natural gas exploration still declined in Q3, from a $47.1 billion annual rate in Q2 to a $42.2 billion annual rate in Q3 - and is down from $149 billion in Q3 2014 (down by more than two-thirds).
Excluding petroleum, non-residential investment in structures increased at a 10% annual rate in Q3.
 Click on graph for larger image.
The first graph shows investment in offices, malls and lodging as a percent of GDP. Office, mall and lodging investment has increased a little recently, but from a very low level.
Investment in offices increased in Q3, and is up 28% year-over-year -increasing from a very low level - and is now above the lows for previous recessions (as percent of GDP).
Investment in multimerchandise shopping structures (malls) peaked in 2007 and was up year-over-year. The vacancy rate for malls is still very high, so investment will probably stay low for some time.
Lodging investment increased further in Q3, and with the hotel occupancy rate near record levels, it is likely that hotel investment will increase further in the near future. Lodging investment is up 23% year-over-year.
My guess is office and hotel investment growth will start to slow (office vacancies are still high, although hotel occupancy is near record levels). But investment growth has been very strong this year.
 The second graph is for Residential investment components as a percent of GDP. According to the Bureau of Economic Analysis, RI includes new single family structures, multifamily structures, home improvement, Brokers’ commissions and other ownership transfer costs, and a few minor categories (dormitories, manufactured homes).
Home improvement was the top category for five consecutive years following the housing bust ... but now investment in single family structures has been back on top for three years and will probably stay there for a long time.
However - even though investment in single family structures has increased from the bottom - single family investment is still very low, and still below the bottom for previous recessions as a percent of GDP. I expect further increases over the next few years.
Investment in single family structures was $237 billion (SAAR) (about 1.3% of GDP), and was down in Q3 compared to Q2, but is down slightly year-over-year.
Investment in home improvement was at a $223 billion Seasonally Adjusted Annual Rate (SAAR) in Q2 (about 1.1% of GDP), and is up 9% year-over-year.
Dallas Fed: Regional Manufacturing Activity Increases in October
by Calculated Risk on 10/31/2016 10:50:00 AM
From the Dallas Fed: Texas Manufacturing Activity Increases Again, but at a Slower Pace
Texas factory activity increased again in October, according to business executives responding to the Texas Manufacturing Outlook Survey. The production index, a key measure of state manufacturing conditions, posted a fourth consecutive positive reading but moved down to 6.7. This suggests output grew but at a slower pace this month. ...This was the last of the regional Fed surveys for October.
...
The general business activity index has been negative for nearly two years, although it continued to push closer to positive territory in October, coming in at -1.5.
...
Labor market measures indicated flat employment levels and slightly shorter workweek length. The employment index came in at 0.2, suggesting little change in headcounts in October. The hours worked index edged down to -1.8. ...
emphasis added
Here is a graph comparing the regional Fed surveys and the ISM manufacturing index:
 Click on graph for larger image.
The New York and Philly Fed surveys are averaged together (yellow, through October), and five Fed surveys are averaged (blue, through October) including New York, Philly, Richmond, Dallas and Kansas City. The Institute for Supply Management (ISM) PMI (red) is through September (right axis).
It seems likely the ISM manufacturing index will show expansion again in October, and the consensus is for a reading of 51.6.
Black Knight: House Price Index up 0.3% in August, Up 5.3% year-over-year
by Calculated Risk on 10/31/2016 09:30:00 AM
Note: I follow several house price indexes (Case-Shiller, CoreLogic, Black Knight, Zillow, FHFA, FNC and more). Note: Black Knight uses the current month closings only (not a three month average like Case-Shiller or a weighted average like CoreLogic), excludes short sales and REOs, and is not seasonally adjusted.
From Black Knight: Black Knight Home Price Index Report: August 2016 Transactions U.S. Home Prices Up 0.3 Percent for the Month; Up 5.3 Percent Year-Over-Year
• August’s 5.3 percent annual home price appreciation (HPA) continues a trend of very stable growth, with seven of the last eight months seeing the same rate of annual HPAThe year-over-year increase in this index has been about the same for the last year.
• At $266K, the U.S. is now within just 0.7 percent of a new national peak and up over 33 percent from the market’s bottom
• Nine states saw negative monthly price movement, led by South Carolina, North Dakota, Virginia, Connecticut and Missouri, all down 0.3 percent from July
• Home prices in nine of the nation’s 20 largest states and nine of the 40 largest metros hit new peaks
Note that house prices are close to the bubble peak in nominal terms, but not in real terms (adjusted for inflation).
Personal Income increased 0.3% in September, Spending increased 0.5%
by Calculated Risk on 10/31/2016 08:36:00 AM
The BEA released the Personal Income and Outlays report for September:
Personal income increased $46.7 billion (0.3 percent) in September according to estimates released today by the Bureau of Economic Analysis ... Personal consumption expenditures (PCE) increased $61.0 billion (0.5 percent).On inflation: The PCE price index increased 1.2 percent year-over-year due to the sharp decline in oil prices (This was up from 1.0% year-over-year in August). The core PCE price index (excluding food and energy) increased 1.7 percent year-over-year in September (the same as in August).
...
Real PCE increased 0.3 percent. The PCE price index increased 0.2 percent. Excluding food and energy, the PCE price index increased 0.1 percent.
Sunday, October 30, 2016
Sunday Night Futures: Gasoline Prices up Slightly Year-over-year
by Calculated Risk on 10/30/2016 06:24:00 PM
Weekend:
• Schedule for Week of Oct 30, 2016
• "How do I protect myself if Trump is elected?"
Monday:
• At 8:30 AM ET, Personal Income and Outlays for September. The consensus is for a 0.4% increase in personal income, and for a 0.5% increase in personal spending. And for the Core PCE price index to increase 0.1%.
• At 9:45 AM, the Chicago Purchasing Managers Index for October. The consensus is for a reading of 54.3, up from 54.2 in September.
• At 10:30 AM, the Dallas Fed Survey of Manufacturing Activity for October. This is the last of the regional Fed surveys for October.
From CNBC: Pre-Market Data and Bloomberg futures: S&P futures and DOW futures are down slightly (fair value).
Oil prices were down over the last week with WTI futures at $48.70 per barrel and Brent at $49.71 per barrel. A year ago, WTI was at $47, and Brent was at $48 - so oil prices are UP slightly year-over-year.
Here is a graph from Gasbuddy.com for nationwide gasoline prices. Nationally prices are at $2.20 per gallon - a year ago prices were $2.18 per gallon - so gasoline prices are up slightly year-over-year.
"How do I protect myself if Trump is elected?"
by Calculated Risk on 10/30/2016 12:01:00 PM
Quite a few readers have asked me this question. My usual answer is that I expect Ms. Clinton to be elected President, and that the expansion will continue.
I've spoken to several key analysts and economists, and for their forecasts, all are assuming Ms. Clinton will be the next President (my forecasts also assume a Clinton presidency). So if Trump is elected, expect some market volatility as forecasts are changed. As Merrill Lynch recently noted:
"As our strategists have noted, the initial reaction to a potential Trump victory would likely be a risk-off event in the markets, which we think could end up delaying the Fed from hiking in December."That is just a guess at the short term reaction. The general rule is don't invest based on your political views.
However policy does matter for investing and the economy. As an example, it was obvious to invest in oil when George W. Bush became President. And insurance companies like United Healthcare and Aetna seemed like good bets with a President Obama.
Another example of policy is the deregulation of banks (and the anti-regulation attitude of the Bush administration) as part of the housing bubble story.
But what about with Mr. Trump? He has said he'd "build a wall" along the border with Mexico, renegotiate all trade deals, cut taxes on high income earners, repeal Obamacare and more. But it is unclear what he'd actually do as President. As an example, no one really thinks a wall will be built along the entire border (maybe sections of a wall - and Mexico wouldn't pay for it).
Repealing the ACA - without a replacement - would lead to many millions of Americans without health insurance. And those with preexisting conditions would be uninsurable. This seems politically unlikely (without a replacement policy), but if it happens, sell those health insurance companies.
Right now it is hard to guess what policy would look like with Mr. Trump (Trump doesn't seem to understand policy issues - like his ignorant comments on the VAT while talking about trade with Mexico). One key concern with Trump is the potential for a trade war - and that could happen almost without warning.
Long time readers remember when I used to write about the impact of policy (both good and bad), but there hasn't been much policy to discuss for the last few years. If Trump is elected, I'd expect a GOP sweep, and then I'll be writing frequently about policy again. Since Trump is at war with the data (he rejects data that doesn't fit his views), I don't expect evidence based policy proposals - and that almost always means bad results.
Until we see the actual policy proposals, it is hard to predict the impact. I will not predict a recession just because Trump is elected, but I do think the economy would perform better under Clinton than Trump.
Also, the words of a President matter. Mr Trump has been reckless and irresponsible with his comments, and that would probably continue. One absurd comment could send the markets into a tailspin (and that could happen at any time). That should make investors more cautious (as an example, I'm recommending that my home builder friends ease back on their spec building if Trump is elected).
In conclusion: I expect Ms. Clinton to be elected and I'm currently taking no action to protect myself against the risks of a Trump presidency. The risks are real, but I think the odds of Trump winning are very low. If the unimaginable happens, I'll be writing about when to head to the bunker.
Saturday, October 29, 2016
October 2016: Unofficial Problem Bank list declines to 173 Institutions
by Calculated Risk on 10/29/2016 02:45:00 PM
This is an unofficial list of Problem Banks compiled only from public sources.
Here is the unofficial problem bank list for October 2016.
Changes and comments from surferdude808:
Update on the Unofficial Problem Bank List for October 2016. During the month, the list fell from 177 institutions to 173 after five removals and one addition. Assets dropped by $562 million to an aggregate $54.9 billion. A year ago, the list held 264 institutions with assets of $79.2 billion.
Actions have been terminated against Horry County State Bank, Loris, SC ($383 million Ticker: HCFB) and Heritage Community Bank, Greeneville, TN ($89 million). Finding merger partners were Landmark Community Bank, National Association, Isanti, MN ($80 million); Citizens State Bank, Kingsland, GA ($56 million); and Home Savings Bank, Jefferson City, MO ($24 million). Added this month was The First National Bank of Lacon, Lacon, IL ($70 million).
In a change, the OCC released an update on its enforcement action activity today, the last Friday of the month. Historically, the OCC has issued its update on the first Friday following the 15th of the month. While the FDIC provides a release on the last Friday of the month as well; however, it only includes action changes for the preceding month, so their information has a longer lag time. Conversely, the Federal Reserve releases individual action changes as they occur instead of waiting to accumulate them in a monthly release.
Schedule for Week of Oct 30, 2016
by Calculated Risk on 10/29/2016 08:12:00 AM
The key report this week is the October employment report on Friday.
Other key indicators include the October ISM manufacturing and non-manufacturing indexes, October auto sales, and the September trade deficit.
The FOMC meets on Tuesday and Wednesday, and no change to policy is expected.
8:30 AM ET: Personal Income and Outlays for September. The consensus is for a 0.4% increase in personal income, and for a 0.5% increase in personal spending. And for the Core PCE price index to increase 0.1%.
9:45 AM: Chicago Purchasing Managers Index for October. The consensus is for a reading of 54.3, up from 54.2 in September.
10:30 AM: Dallas Fed Survey of Manufacturing Activity for October. This is the last of the regional Fed surveys for October.
 10:00 AM: ISM Manufacturing Index for October. The consensus is for the ISM to be at 51.6, up from 51.5 in September.
Here is a long term graph of the ISM manufacturing index.
The ISM manufacturing index indicated expansion at 51.5% in September. The employment index was at 49.7%, and the new orders index was at 55.1%.
10:00 AM: Construction Spending for September. The consensus is for a 0.6% increase in construction spending.
 All day: Light vehicle sales for October. The consensus is for light vehicle sales to decrease to 17.6 million SAAR in October, from 17.7 million in September (Seasonally Adjusted Annual Rate).
This graph shows light vehicle sales since the BEA started keeping data in 1967. The dashed line is the September sales rate.
7:00 AM ET: The Mortgage Bankers Association (MBA) will release the results for the mortgage purchase applications index.
8:15 AM: The ADP Employment Report for October. This report is for private payrolls only (no government). The consensus is for 170,000 payroll jobs added in October, up from 154,000 added in September.
2:00 PM: FOMC Meeting Announcement. No change to policy is expected at this meeting.
8:30 AM ET: The initial weekly unemployment claims report will be released. The consensus is for 255 thousand initial claims, down from 258 thousand the previous week.
10:00 AM: Manufacturers' Shipments, Inventories and Orders (Factory Orders) for September. The consensus is a 0.2% increase in orders.
10:00 AM: the ISM non-Manufacturing Index for October. The consensus is for index to decrease to 56.1 from 57.1 in August.
8:30 AM: Employment Report for October. The consensus is for an increase of 178,000 non-farm payroll jobs added in October, up from the 156,000 non-farm payroll jobs added in September.
The consensus is for the unemployment rate to decline to 4.9%.
 This graph shows the year-over-year change in total non-farm employment since 1968.
In September, the year-over-year change was 2.45 million jobs.
A key will be the change in wages.
 8:30 AM: Trade Balance report for September from the Census Bureau.
 This graph shows the U.S. trade deficit, with and without petroleum, through July. The blue line is the total deficit, and the black line is the petroleum deficit, and the red line is the trade deficit ex-petroleum products.
The consensus is for the U.S. trade deficit to be at $38.9 billion in September from $40.7 billion in August.
Friday, October 28, 2016
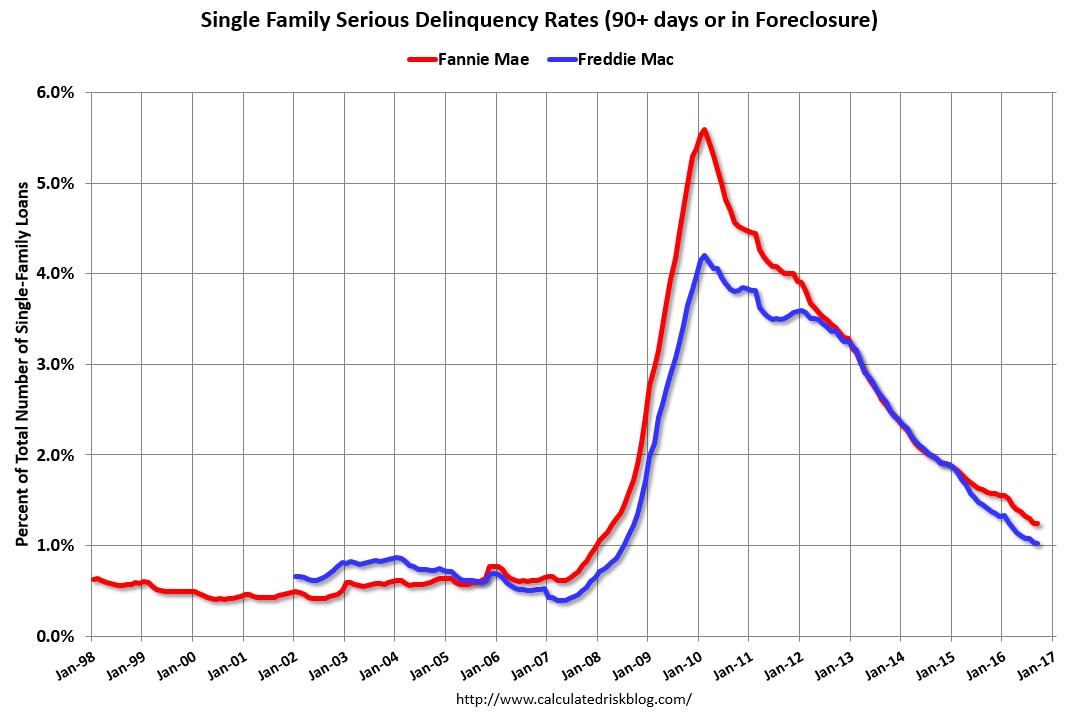
Fannie Mae: Mortgage Serious Delinquency rate unchanged in September
by Calculated Risk on 10/28/2016 05:04:00 PM
Fannie Mae reported today that the Single-Family Serious Delinquency rate was at 1.24% in September, unchanged from 1.24% in August. The serious delinquency rate is down from 1.59% in September 2015.
These are mortgage loans that are "three monthly payments or more past due or in foreclosure".
The Fannie Mae serious delinquency rate peaked in February 2010 at 5.59%.
 Click on graph for larger image
Although the rate is generally declining, the "normal" serious delinquency rate is under 1%.
The Fannie Mae serious delinquency rate has fallen 0.35 percentage points over the last year, and at that rate of improvement, the serious delinquency rate will not be below 1% for about 8 more months.
Note: Freddie Mac reported yesterday.
Q3 GDP: Investment
by Calculated Risk on 10/28/2016 02:05:00 PM
The graph below shows the contribution to GDP from residential investment, equipment and software, and nonresidential structures (3 quarter trailing average). This is important to follow because residential investment tends to lead the economy, equipment and software is generally coincident, and nonresidential structure investment trails the economy.
In the graph, red is residential, green is equipment and software, and blue is investment in non-residential structures. So the usual pattern - both into and out of recessions is - red, green, blue.
The dashed gray line is the contribution from the change in private inventories.
 Click on graph for larger image.
Residential investment (RI) decreased at a 6.2% annual rate in Q3. Equipment investment decreased at a 2.7% annual rate, and investment in non-residential structures increased at a 5.4% annual rate.
On a 3 quarter trailing average basis, RI (red) is unchanged, equipment (green) is slightly negative, and nonresidential structures (blue) is slightly positive.
I'll post more on the components of non-residential investment once the supplemental data is released.
I expect investment to pick up going forward, and for the economy to grow at a steady pace.

The second graph shows residential investment as a percent of GDP.
Residential Investment as a percent of GDP has generally been increasing, but is only just above the bottom of the previous recessions - and I expect RI to continue to increase for the next few years.
I'll break down Residential Investment into components after the GDP details are released.
Note: Residential investment (RI) includes new single family structures, multifamily structures, home improvement, broker's commissions, and a few minor categories.
 The third graph shows non-residential investment in structures, equipment and "intellectual property products". Investment in equipment - as a percent of GDP - has declined a little recently.. Investment in nonresidential structures - as a percent of GDP - had been moving down due to less investment in energy and power, and is now moving sideways.
Still no worries - residential investment will pickup (still very low), and non-residential will also pickup.
Goldman: FOMC Preview
by Calculated Risk on 10/28/2016 11:11:00 AM
A few excerpts from a piece by Goldman Sachs economists Zach Pandl and Jan Hatzius
• We expect the statement following next week’s FOMC meeting to remain relatively upbeat about US growth prospects ... However, the committee is very unlikely to raise the funds rate. ...CR note: The next FOMC meeting is next week, on November 1st and 2nd and it seems very unlikely there will be a change in policy at this meeting.
• To keep markets on notice for a possible rate hike in December, we expect the statement to indicate that the committee is considering action “at its next meeting”—although this is a close call. The statement will likely again say that risks to the economic outlook are “roughly balanced”.
• A statement along these lines should keep the committee on track to raise the funds rate at the December meeting. We see a 75% chance of an increase, roughly in line with market expectations. The remaining uncertainty relates to incoming economic data and financial conditions ... conditional on decent data and stable markets, a December rate hike looks very likely.
October Consumer Sentiment declines to 87.2
by Calculated Risk on 10/28/2016 10:04:00 AM
The final University of Michigan consumer sentiment index for October was at 87.2, down from the preliminary estimate of 87.9, and down from 91.2 in September.
The Sentiment Index slipped in October to the same low recorded last September and to the lowest level since October 2014. The October decline was due to less favorable prospects for the national economy, with half of all consumers anticipating an economic downturn sometime in the next five years for the first time since October 2014. Objectively, the probability of a downturn during the next five years is far from zero-this would be the longest expansion in 150 years if it lasted just over half of the five year horizon. Nonetheless, the October rise may simply reflect a temporary bout of uncertainty caused by the election.
emphasis added

Click on graph for larger image.
BEA: Real GDP increased at 2.9% Annualized Rate in Q3
by Calculated Risk on 10/28/2016 08:34:00 AM
From the BEA: Gross Domestic Product: Third Quarter 2016 (Advance Estimate)
Real gross domestic product increased at an annual rate of 2.9 percent in the third quarter of 2016, according to the "advance" estimate released by the Bureau of Economic Analysis. In the second quarter, real GDP increased 1.4 percent.The advance Q1 GDP report, with 2.9% annualized growth, was above expectations of a 2.5% increase.
...
he increase in real GDP in the third quarter reflected positive contributions from personal consumption expenditures (PCE), exports, private inventory investment, federal government spending, and nonresidential fixed investment that were partly offset by negative contributions from residential fixed investment and state and local government spending. Imports, which are a subtraction in the calculation of GDP, increased.
The acceleration in real GDP growth in the third quarter reflected an upturn in private inventory investment, an acceleration in exports, a smaller decrease in state and local government spending, and an upturn in federal government spending. These were partly offset by a smaller increase in PCE, and a larger increase in imports.
emphasis added
Personal consumption expenditures (PCE) increased at a 2.1% annualized rate in Q3, down from 4.3% in Q2. Residential investment (RI) decreased at a 6.2% pace. Equipment investment decreased at a 2.7% annualized rate, and investment in non-residential structures increased at a 5.4% pace.
I'll have more later ...
Thursday, October 27, 2016
Friday: GDP
by Calculated Risk on 10/27/2016 08:34:00 PM
From Goldman Sachs economist Elad Pashtan
Our final Q3 GDP tracking estimate stands at +2.9% (qoq ar), roughly in line with the consensus of forecasts that were updated after the September trade report. We look for a strong boost from net exports, solid consumer spending, a small contribution from capital expenditures, and another (albeit smaller) drag from inventories.Friday:
• At 8:30 AM ET, Gross Domestic Product, 3rd quarter 2016 (Advance estimate). The consensus is that real GDP increased 2.5% annualized in Q3.
• At 10:00 AM, University of Michigan's Consumer sentiment index (final for October). The consensus is for a reading of 88.5, up from the preliminary reading 87.9.
Freddie Mac: Mortgage Serious Delinquency rate declined slightly in September, Lowest since July 2008
by Calculated Risk on 10/27/2016 02:50:00 PM
Freddie Mac reported that the Single-Family serious delinquency rate declined in September to 1.02%, down from 1.03% in August. Freddie's rate is down from 1.41% in September 2015.
This is the lowest rate since July 2008.
Freddie's serious delinquency rate peaked in February 2010 at 4.20%.
These are mortgage loans that are "three monthly payments or more past due or in foreclosure".
 Click on graph for larger image
Although the rate is generally declining, the "normal" serious delinquency rate is under 1%.
The Freddie Mac serious delinquency rate has fallen 0.39 percentage points over the last year, and at that rate of improvement, the serious delinquency rate could be below 1% next month (October).
Note: Fannie Mae will report in the next few days.
HVS: Q3 2016 Homeownership and Vacancy Rates
by Calculated Risk on 10/27/2016 12:35:00 PM
The Census Bureau released the Residential Vacancies and Homeownership report for Q3 2016.
This report is frequently mentioned by analysts and the media to track household formation, the homeownership rate, and the homeowner and rental vacancy rates. However, there are serious questions about the accuracy of this survey.
This survey might show the trend, but I wouldn't rely on the absolute numbers. The Census Bureau is investigating the differences between the HVS, ACS and decennial Census, and analysts probably shouldn't use the HVS to estimate the excess vacant supply or household formation, or rely on the homeownership rate, except as a guide to the trend.
 Click on graph for larger image.
The Red dots are the decennial Census homeownership rates for April 1st 1990, 2000 and 2010. The HVS homeownership rate increased to 63.5% in Q3, from 62.9% in Q2.
I'd put more weight on the decennial Census numbers - and given changing demographics, the homeownership rate is probably close to a bottom.
 The HVS homeowner vacancy was unchanged at 1.8% in Q2.
Once again - this probably shows the general trend, but I wouldn't rely on the absolute numbers.
 The rental vacancy rate increased to 6.8% in Q2.
I think the Reis quarterly survey (large apartment owners only in selected cities) is a much better measure of the rental vacancy rate - and the Reis survey is showing rental vacancy rates have started to increase slightly.
The quarterly HVS is the most timely survey on households, but there are many questions about the accuracy of this survey.
Overall this suggests that vacancies have declined significantly, and my guess is the homeownership rate is probably close to the bottom.
Kansas City Fed: Regional Manufacturing Activity "Expanded Moderately" in October
by Calculated Risk on 10/27/2016 11:00:00 AM
From the Kansas City Fed: Tenth District Manufacturing Activity Expanded Moderately
The Federal Reserve Bank of Kansas City released the October Manufacturing Survey today. According to Chad Wilkerson, vice president and economist at the Federal Reserve Bank of Kansas City, the survey revealed that Tenth District manufacturing activity expanded again at a moderate pace.The Kansas City region was hit hard by the decline in oil prices, and it appears activity is starting to expand again.
“This was the second consecutive month of rising factory activity in the Tenth District, the first time that has happened in nearly two years,” said Wilkerson. “Much of the improvement recently has been in machinery and fabricated metals manufacturing.”
...
The month-over-month composite index was 6 in October, equal to 6 in September and up from -4 in August ... Most month-over-month indexes improved further in October. The production index edged higher from 15 to 18, and the shipments, new orders, and order backlog also rose moderately. The employment index climbed from -3 to 7, its highest level in almost two years. ...
emphasis added
NAR: Pending Home Sales Index increased 1.5% in September, up 2.4% year-over-year
by Calculated Risk on 10/27/2016 10:03:00 AM
From the NAR: Pending Home Sales Edge Up in September
Pending home sales shifted higher in September following August's notable dip and are now at their fifth highest level over the past year, according to the National Association of Realtors®. Increases in the South and West outgained declines in the Northeast and Midwest.This was above expectations of a 1.0% increase for this index. Note: Contract signings usually lead sales by about 45 to 60 days, so this would usually be for closed sales in October and November.
The Pending Home Sales Index, a forward-looking indicator based on contract signings, grew 1.5 percent to 110.0 in September from a slight downward revision of 108.4 in August. With last month's gain, the index is now 2.4 percent higher than last September (107.4) and has now risen year-over-year for 22 of the last 25 months.
...
The PHSI in the Northeast fell 1.6 percent to 96.5 in September, but is still 7.7 percent above a year ago. In the Midwest the index declined modestly (0.2 percent) to 104.6 in September, and is now 1.0 percent lower than September 2015.
Pending home sales in the South rose 1.9 percent to an index of 122.1 in September and are now 1.7 percent higher than last September. The index in the West jumped 4.7 percent in September to 107.3, and is now 4.0 percent above a year ago.
emphasis added
Weekly Initial Unemployment Claims decrease to 258,000
by Calculated Risk on 10/27/2016 08:34:00 AM
The DOL reported:
In the week ending October 22, the advance figure for seasonally adjusted initial claims was 258,000, a decrease of 3,000 from the previous week's revised level. The previous week's level was revised up by 1,000 from 260,000 to 261,000. The 4-week moving average was 253,000, an increase of 1,000 from the previous week's revised average. The previous week's average was revised up by 250 from 251,750 to 252,000.The previous week was revised up.
There were no special factors impacting this week's initial claims. This marks 86 consecutive weeks of initial claims below 300,000, the longest streak since 1970.
The following graph shows the 4-week moving average of weekly claims since 1971.
 Click on graph for larger image.
The dashed line on the graph is the current 4-week average. The four-week average of weekly unemployment claims increased to 253,000.
This was close to the consensus forecast. The low level of claims suggests relatively few layoffs.
Wednesday, October 26, 2016
Thursday: Durable Goods, Unemployment Claims, Pending Home Sales and More
by Calculated Risk on 10/26/2016 08:44:00 PM
Thursday:
• At 8:30 AM ET, the initial weekly unemployment claims report will be released. The consensus is for 255 thousand initial claims, down from 260 thousand the previous week. Note: I expect some further impact on claims due to Hurricane Matthew.
• Also at 8:30 AM, Durable Goods Orders for September from the Census Bureau. The consensus is for a 0.2% increase in durable goods orders.
• At 10:00 AM, Pending Home Sales Index for September. The consensus is for a 1.0% increase in the index.
• Also at 10:00 AM, the Q3 Housing Vacancies and Homeownership from the Census Bureau.
• At 11:00 AM, the Kansas City Fed Survey of Manufacturing Activity for October.
Philly Fed: State Coincident Indexes increased in 36 states in September
by Calculated Risk on 10/26/2016 04:05:00 PM
From the Philly Fed:
The Federal Reserve Bank of Philadelphia has released the coincident indexes for the 50 states for September 2016. In the past month, the indexes increased in 36 states, decreased in 11, and remained stable in three, for a one-month diffusion index of 50. Over the past three months, the indexes increased in 40 states, decreased in nine, and remained stable in one, for a three-month diffusion index of 62.Note: These are coincident indexes constructed from state employment data. An explanation from the Philly Fed:
The coincident indexes combine four state-level indicators to summarize current economic conditions in a single statistic. The four state-level variables in each coincident index are nonfarm payroll employment, average hours worked in manufacturing, the unemployment rate, and wage and salary disbursements deflated by the consumer price index (U.S. city average). The trend for each state’s index is set to the trend of its gross domestic product (GDP), so long-term growth in the state’s index matches long-term growth in its GDP.Philly Fed.
 Click on graph for larger image.
This is a graph is of the number of states with one month increasing activity according to the Philly Fed. This graph includes states with minor increases (the Philly Fed lists as unchanged).
In September, 39 states had increasing activity (including minor increases).
Eight states have seen declines over the last 6 months, in order the five worst are Wyoming (worst), Alaska, Louisiana, Kansas, Oklahoma - mostly due to the decline in oil prices.
 Here is a map of the three month change in the Philly Fed state coincident indicators. This map was all red during the worst of the recession, and is mostly green now.
Source: Philly Fed. Note: For complaints about red / green issues, please contact the Philly Fed.
Zillow Forecast: Expect "Modest Acceleration" in YoY Growth in September for the Case-Shiller Indexes
by Calculated Risk on 10/26/2016 01:31:00 PM
The Case-Shiller house price indexes for August were released yesterday. Zillow forecasts Case-Shiller a month early, and I like to check the Zillow forecasts since they have been pretty close.
From Zillow: September Case-Shiller Forecast: Modest Acceleration in Home Price Growth Will Continue
According to Zillow’s September Case-Shiller forecast, the national index and both smaller 10 and 20-city indices look set to continue the acceleration in home price growth they exhibited in August. And after more than two years of steady growth around 5 percent annually, the U.S. National Case-Shiller home price index is within striking distance of reaching its July 2006 peak levels, just 0.1 percent off those levels, according to today’s data.The year-over-year change for the 10-city and 20-city indexes will probably be about the same in the September report as in the August report. The change for the National index will probably be slightly higher.
The September Case-Shiller National Index is expected to grow 5.4 percent year-over-year and 0.7 percent month-to-month (seasonally adjusted). We expect the 10-City Index to grow 4.3 percent year-over-year and 0.3 percent (SA) from July. The 20-City Index is expected to grow 5.1 percent between September 2015 and September 2016, and rise 0.4 percent (SA) from August.
Zillow’s September Case-Shiller forecast is shown in the table below. These forecasts are based on today’s August Case-Shiller data release and the September 2016 Zillow Home Value Index (ZHVI). The September S&P CoreLogic Case-Shiller Indices will not be officially released until Tuesday, November 29.

A few Comments on September New Home Sales
by Calculated Risk on 10/26/2016 11:23:00 AM
New home sales for September were reported below the consensus forecast at 593,000 on a seasonally adjusted annual rate basis (SAAR). And the three previous months were all revised down significantly.
However, sales were up 29.8% year-over-year in September, and this is the best month for September (NSA) since 2007. And sales are up 13.0% year-to-date compared to the same period in 2015.
The glass is more than half full. This is very solid year-over-year growth.
Earlier: New Home Sales at 593,000 Annual Rate in September.
 Click on graph for larger image.
This graph shows new home sales for 2015 and 2016 by month (Seasonally Adjusted Annual Rate). Sales to date are up 13.0% year-over-year, because of very strong year-over-year growth over the last six months.
Overall I expected lower growth this year, in the 4% to 8% range. Slower growth seemed likely this year because Houston (and other oil producing areas) will have a problem this year. It looks like I was too pessimistic on new home sales this year.
And here is another update to the "distressing gap" graph that I first started posting a number of years ago to show the emerging gap caused by distressed sales. Now I'm looking for the gap to close over the next several years.
 The "distressing gap" graph shows existing home sales (left axis) and new home sales (right axis) through September 2016. This graph starts in 1994, but the relationship had been fairly steady back to the '60s.
Following the housing bubble and bust, the "distressing gap" appeared mostly because of distressed sales.
I expect existing home sales to move more sideways, and I expect this gap to slowly close, mostly from an increase in new home sales.
However, this assumes that the builders will offer some smaller, less expensive homes. If not, then the gap will persist.
 Another way to look at this is a ratio of existing to new home sales.
This ratio was fairly stable from 1994 through 2006, and then the flood of distressed sales kept the number of existing home sales elevated and depressed new home sales. (Note: This ratio was fairly stable back to the early '70s, but I only have annual data for the earlier years).
In general the ratio has been trending down, and this ratio will probably continue to trend down over the next several years.
Note: Existing home sales are counted when transactions are closed, and new home sales are counted when contracts are signed. So the timing of sales is different.
New Home Sales at 593,000 Annual Rate in September
by Calculated Risk on 10/26/2016 10:12:00 AM
The Census Bureau reports New Home Sales in September were at a seasonally adjusted annual rate (SAAR) of 593 thousand.
The previous three months were revised down by a total of 85 thousand (SAAR).
"Sales of new single-family houses in September 2016 were at a seasonally adjusted annual rate of 593,000, according to estimates released jointly today by the U.S. Census Bureau and the Department of Housing and Urban Development. This is 3.1 percent above the revised August rate of 575,000 and is 29.8 percent above the September 2015 estimate of 457,000. "
emphasis added
 Click on graph for larger image.
The first graph shows New Home Sales vs. recessions since 1963. The dashed line is the current sales rate.
Even with the increase in sales since the bottom, new home sales are still fairly low historically.
The second graph shows New Home Months of Supply.
 The months of supply decreased in September to 4.8 months.
 The all time record was 12.1 months of supply in January 2009.
This is now in the normal range (less than 6 months supply is normal).
"The seasonally adjusted estimate of new houses for sale at the end of September was 235,000. This represents a supply of 4.8 months at the current sales rate."
 On inventory, according to the Census Bureau:
 "A house is considered for sale when a permit to build has been issued in permit-issuing places or work has begun on the footings or foundation in nonpermit areas and a sales contract has not been signed nor a deposit accepted."Starting in 1973 the Census Bureau broke this down into three categories: Not Started, Under Construction, and Completed.
The third graph shows the three categories of inventory starting in 1973.
The inventory of completed homes for sale is still low, and the combined total of completed and under construction is also low.
 The last graph shows sales NSA (monthly sales, not seasonally adjusted annual rate).
In September 2016 (red column), 50 thousand new homes were sold (NSA). Last year 35 thousand homes were sold in September.
The all time high for September was 99 thousand in 2005, and the all time low for September was 24 thousand in 2011.
This was below expectations of 600,000 sales SAAR in September. I'll have more later today.
MBA: "Mortgage Applications Decrease in Latest MBA Weekly Survey"
by Calculated Risk on 10/26/2016 07:00:00 AM
From the MBA: Mortgage Applications Decrease in Latest MBA Weekly Survey
Mortgage applications decreased 4.1 percent from one week earlier, according to data from the Mortgage Bankers Association’s (MBA) Weekly Mortgage Applications Survey for the week ending October 21, 2016. The prior week’s results included an adjustment for the Columbus Day holiday.
... The Refinance Index decreased 2 percent from the previous week to its lowest level since June 2016. The seasonally adjusted Purchase Index decreased 7 percent from one week earlier to its lowest level since January 2016. The unadjusted Purchase Index increased 3 percent compared with the previous week and was 9 percent higher than the same week one year ago.
...
The average contract interest rate for 30-year fixed-rate mortgages with conforming loan balances ($417,000 or less) decreased to 3.71 percent from 3.73 percent, with points increasing to 0.37 from 0.36 (including the origination fee) for 80 percent loan-to-value ratio (LTV) loans.
emphasis added
 Click on graph for larger image.
The first graph shows the refinance index since 1990.
Refinance activity increased this year since rates declined, however, since rates are up a little recently, refinance activity has declined a little.
 The second graph shows the MBA mortgage purchase index.
 The purchase index was "9 percent higher than the same week one year ago".
Tuesday, October 25, 2016
Wednesday: New Home Sales
by Calculated Risk on 10/25/2016 07:27:00 PM
From Matthew Graham at Mortgage News Daily: Mortgage Rates Stuck at Highs For Now
Mortgage Rates were unchanged in many cases today, with a handful of lenders inconsequentially better or worse versus yesterday's latest offerings [at 3.55% for 30 year fixed]. Despite moving lower on 4 out of the past 6 days, rates were never able to put meaningful distance between themselves and the highest levels in more than 4 months.Wednesday:
emphasis added
• At 7:00 AM ET, The Mortgage Bankers Association (MBA) will release the results for the mortgage purchase applications index.
• At 10:00 AM, New Home Sales for September from the Census Bureau. The consensus is for a decrease in sales to 600 thousand Seasonally Adjusted Annual Rate (SAAR) in September from 609 thousand in August.
Chemical Activity Barometer indicated Solid Growth in October
by Calculated Risk on 10/25/2016 02:31:00 PM
Here is an indicator that I'm following that appears to be a leading indicator for industrial production.
From the American Chemistry Council: Chemical Activity Barometer Enters Third Quarter with Strong Performance
The Chemical Activity Barometer (CAB), a leading economic indicator created by the American Chemistry Council (ACC), notched another solid gain of 0.3 percent in October, following an upwardly revised gain of 0.4 percent in September. Accounting for adjustments, the CAB is up 4.2 percent over this time last year, a marked increase over earlier comparisons and the greatest year-over-year gain since August 2014. All data is measured on a three-month moving average (3MMA). On an unadjusted basis the CAB climbed 0.3 percent in October, following a 0.4 percent gain in September.
...
Applying the CAB back to 1912, it has been shown to provide a lead of two to fourteen months, with an average lead of eight months at cycle peaks as determined by the National Bureau of Economic Research. The median lead was also eight months. At business cycle troughs, the CAB leads by one to seven months, with an average lead of four months. The median lead was three months. The CAB is rebased to the average lead (in months) of an average 100 in the base year (the year 2012 was used) of a reference time series. The latter is the Federal Reserve’s Industrial Production Index.
emphasis added
 Click on graph for larger image.
This graph shows the year-over-year change in the 3-month moving average for the Chemical Activity Barometer compared to Industrial Production. It does appear that CAB (red) generally leads Industrial Production (blue).
Currently CAB has increased solidly over the last several months, and this suggests an increase in Industrial Production over the next year.
Real Prices and Price-to-Rent Ratio in August
by Calculated Risk on 10/25/2016 11:55:00 AM
Here is the earlier post on Case-Shiller: Case-Shiller: National House Price Index increased 5.3% year-over-year in August
The year-over-year increase in prices is mostly moving sideways now around 5%. In August, the index was up 5.3% YoY.
In the earlier post, I graphed nominal house prices, but it is also important to look at prices in real terms (inflation adjusted). Case-Shiller, CoreLogic and others report nominal house prices. As an example, if a house price was $200,000 in January 2000, the price would be close to $275,000 today adjusted for inflation (37%). That is why the second graph below is important - this shows "real" prices (adjusted for inflation).
It has been almost ten years since the bubble peak. In the Case-Shiller release this morning, the National Index was reported as being only 1.6% below the bubble peak (seasonally adjusted). However, in real terms, the National index is still about 16.2% below the bubble peak.
Nominal House Prices
 The first graph shows the monthly Case-Shiller National Index SA, the monthly Case-Shiller Composite 20 SA, and the CoreLogic House Price Indexes (through August) in nominal terms as reported.
In nominal terms, the Case-Shiller National index (SA) is back to December 2005 levels, and the Case-Shiller Composite 20 Index (SA) is back to June 2005 levels, and the CoreLogic index (NSA) is back to August 2005.
Real House Prices
 The second graph shows the same three indexes in real terms (adjusted for inflation using CPI less Shelter). Note: some people use other inflation measures to adjust for real prices.
CPI less Shelter has declined over the last two years pushing up real house prices.
In real terms, the National index is back to February 2004 levels, the Composite 20 index is back to October 2003, and the CoreLogic index back to January 2004.
In real terms, house prices are back to late 2003 / early 2004 levels.
Price-to-Rent
In October 2004, Fed economist John Krainer and researcher Chishen Wei wrote a Fed letter on price to rent ratios: House Prices and Fundamental Value. Kainer and Wei presented a price-to-rent ratio using the OFHEO house price index and the Owners' Equivalent Rent (OER) from the BLS.
 Here is a similar graph using the Case-Shiller National, Composite 20 and CoreLogic House Price Indexes.
This graph shows the price to rent ratio (January 1998 = 1.0).
On a price-to-rent basis, the Case-Shiller National index is back to August 2003 levels, the Composite 20 index is back to April 2003 levels, and the CoreLogic index is back to July 2003.
In real terms, and as a price-to-rent ratio, prices are back to late 2003 - and the price-to-rent ratio maybe moving a little more sideways now.
Case-Shiller: National House Price Index increased 5.3% year-over-year in August
by Calculated Risk on 10/25/2016 09:12:00 AM
S&P/Case-Shiller released the monthly Home Price Indices for August ("August" is a 3 month average of June, July and August prices).
This release includes prices for 20 individual cities, two composite indices (for 10 cities and 20 cities) and the monthly National index.
Note: Case-Shiller reports Not Seasonally Adjusted (NSA), I use the SA data for the graphs.
From S&P: Home Price Gains Continues in August According to the S&P CoreLogic Case-Shiller Indices
The S&P CoreLogic Case-Shiller U.S. National Home Price NSA Index, covering all nine U.S. census divisions, reported a 5.3% annual gain in August, up from 5.0% last month. The 10-City Composite posted a 4.3% annual increase, up from 4.1% the previous month. The 20-City Composite reported a year-over-year gain of 5.1%, up from 5.0% in July.
...
Before seasonal adjustment, the National Index posted a month-over-month gain of 0.5% in August. Both the 10-City Composite and the 20-City Composite posted a 0.4% increase in August. After seasonal adjustment, the National Index recorded a 0.6% month-over-month increase, and both the 10-City Composite and the 20-City Composite reported 0.2% month-over-month increases. After seasonal adjustment, 14 cities saw prices rise, two cities were unchanged, and four cities experienced negative monthly prices changes.
emphasis added
 Click on graph for larger image.
 The first graph shows the nominal seasonally adjusted Composite 10, Composite 20 and National indices (the Composite 20 was started in January 2000).
The Composite 10 index is off 10.9% from the peak, and up 0.2% in August (SA).
The Composite 20 index is off 8.9% from the peak, and up 0.2% (SA) in August.
The National index is off 1.6% from the peak (SA), and up 0.6% (SA) in August. The National index is up 33.0% from the post-bubble low set in December 2011 (SA).
 The second graph shows the Year over year change in all three indices.
The Composite 10 SA is up 4.3% compared to August 2015.
The Composite 20 SA is up 5.1% year-over-year.
The National index SA is up 5.3% year-over-year.
Note: According to the data, prices increased in 15 of 20 cities month-over-month seasonally adjusted.
I'll have more later.
Black Knight: Mortgage "Foreclosure Rate Falls to Nine-Year Low" in September
by Calculated Risk on 10/25/2016 07:01:00 AM
From Black Knight: Black Knight’s First Look at September Mortgage Data: Post-‘Brexit’ Prepay Activity Remains Strong; Foreclosure Rate Falls to Nine-Year Low
• Despite declining from August, September saw the third highest prepayment rate in three yearsAccording to Black Knight's First Look report for September, the percent of loans delinquent increased slightly in September compared to August, and declined 12.2% year-over-year.
• September’s less-than-one-percent seasonal increase in the delinquency rate was relatively mild by historical standards
• At one percent, the rate of all mortgages that are in active foreclosure fell to its lowest point in nine years
• Non-current mortgage rates continue to struggle in oil states, with Alaska and Wyoming seeing the largest increases over the past six months
The percent of loans in the foreclosure process declined 3.4% in September and were down 31.2% over the last year.
Black Knight reported the U.S. mortgage delinquency rate (loans 30 or more days past due, but not in foreclosure) was 4.27% in September, up from 4.24% in August.
The percent of loans in the foreclosure process declined in September to 1.00%.
The number of delinquent properties, but not in foreclosure, is down 292,000 properties year-over-year, and the number of properties in the foreclosure process is down 228,000 properties year-over-year.
Black Knight will release the complete mortgage monitor for September on November 7th.
| Black Knight: Percent Loans Delinquent and in Foreclosure Process | ||||
|---|---|---|---|---|
| Sept 2016 | Aug 2016 | Sept 2015 | Sept 2014 | |
| Delinquent | 4.27% | 4.24% | 4.87% | 5.66% |
| In Foreclosure | 1.00% | 1.04% | 1.46% | 1.89% |
| Number of properties: | ||||
| Number of properties that are delinquent, but not in foreclosure: | 2,165,000 | 2,151,000 | 2,457,000 | 2,849,000 |
| Number of properties in foreclosure pre-sale inventory: | 509,000 | 527,000 | 737,000 | 951,000 |
| Total Properties | 2,674,000 | 2,678,000 | 3,194,000 | 3,800,000 |
Monday, October 24, 2016
Lawler: Table of Distressed Sales and All Cash Sales for Selected Cities in September
by Calculated Risk on 10/24/2016 04:29:00 PM
Economist Tom Lawler sent me the table below of short sales, foreclosures and all cash sales for selected cities in September.
On distressed: Total "distressed" share is down year-over-year in most of these markets.
Short sales and foreclosures are down in most of these areas.
The All Cash Share (last two columns) is mostly declining year-over-year. As investors continue to pull back, the share of all cash buyers continues to decline.
| Short Sales Share | Foreclosure Sales Share | Total "Distressed" Share | All Cash Share | |||||
|---|---|---|---|---|---|---|---|---|
| Sep- 2016 | Sep- 2015 | Sep- 2016 | Sep- 2015 | Sep- 2016 | Sep- 2015 | Sep- 2016 | Sep- 2015 | |
| Las Vegas | 4.6% | 6.8% | 6.0% | 7.1% | 10.6% | 13.9% | 26.5% | 26.8% |
| Reno** | 3.0% | 3.0% | 2.0% | 3.0% | 5.0% | 6.0% | ||
| Phoenix | 1.7% | 2.4% | 2.0% | 3.5% | 3.7% | 5.9% | 20.2% | 23.1% |
| Sacramento | 1.4% | 2.9% | 3.1% | 4.1% | 4.5% | 6.9% | 16.3% | 17.6% |
| Minneapolis | 1.1% | 1.9% | 4.3% | 6.6% | 5.4% | 8.5% | 12.8% | 12.5% |
| Mid-Atlantic | 3.1% | 3.9% | 8.9% | 11.1% | 11.9% | 14.9% | 16.5% | 17.5% |
| Florida SF | 2.3% | 3.5% | 7.8% | 16.0% | 10.1% | 19.4% | 28.0% | 34.1% |
| Florida C/TH | 1.6% | 2.1% | 7.0% | 14.3% | 8.6% | 16.4% | 55.8% | 59.7% |
| Miami MSA SF | 3.3% | 5.1% | 9.4% | 18.6% | 12.7% | 23.7% | 28.5% | 33.2% |
| Miami MSA CTH | 2.7% | 2.7% | 9.5% | 18.0% | 12.1% | 20.7% | 58.1% | 63.0% |
| Chicago (city) | 12.1% | 17.5% | ||||||
| Spokane | 7.8% | 7.8% | ||||||
| Northeast Florida | 12.9% | 23.4% | ||||||
| Orlando | 31.3% | 35.5% | ||||||
| Toledo | 28.0% | 26.5% | ||||||
| Tucson | 22.2% | 25.9% | ||||||
| Peoria | 20.5% | 22.3% | ||||||
| Georgia*** | 20.8% | 22.3% | ||||||
| Omaha | 15.5% | 18.1% | ||||||
| Pensacola | 29.1% | 31.4% | ||||||
| Rhode Island | 11.1% | 9.0% | ||||||
| Richmond VA | 8.7% | 10.5% | 18.4% | 15.2% | ||||
| Memphis | 8.8% | 13.1% | ||||||
| Springfield IL** | 9.7% | 10.3% | ||||||
| *share of existing home sales, based on property records **Single Family Only ***GAMLS | ||||||||
DOT: Vehicle Miles Driven increased 3.4% year-over-year in August
by Calculated Risk on 10/24/2016 01:37:00 PM
The Department of Transportation (DOT) reported:
Travel on all roads and streets changed by 3.4% (9.3 billion vehicle miles) for August 2016 as compared with August 2015.The following graph shows the rolling 12 month total vehicle miles driven to remove the seasonal factors.
Travel for the month is estimated to be 284.9 billion vehicle miles.
The seasonally adjusted vehicle miles traveled for August 2016 is 268.6 billion miles, a 2.5% (6.5 billion vehicle miles) increase over August 2015. It also represents a 0.8% decrease (-2.2 billion vehicle miles) compared with July 2016.
The rolling 12 month total is moving up - mostly due to lower gasoline prices - after moving sideways for several years.
 Click on graph for larger image.
In the early '80s, miles driven (rolling 12 months) stayed below the previous peak for 39 months.
Miles driven (rolling 12) had been below the previous peak for 85 months - an all time record - before reaching a new high for miles driven in January 2015.
The second graph shows the year-over-year change from the same month in the previous year. Miles driven are up 3.4% year-over-year.
 In August 2016, gasoline averaged $2.28 per gallon according to the EIA. That was down from August 2015 when prices averaged $2.73 per gallon.
Gasoline prices aren't the only factor - demographics are also important. However, with lower gasoline prices, miles driven on a rolling 12 month basis, is setting a new high each month.
WSJ: "Retailers Rushed to Hire for Holidays"
by Calculated Risk on 10/24/2016 10:40:00 AM
From the Eric Morath at the WSJ: Retailers Rushed to Hire for Holidays, a Sign of Tight Labor Market
Retailers geared up to hire holiday-season workers in August this year, an unusually early start showing how competition has intensified for temporary help in a tight labor market.Typically retail companies start hiring for the holiday season in October, and really increase hiring in November. Here is a graph that shows the historical net retail jobs added for October, November and December by year.
Data from job-search site Indeed.com shows retailers, and the warehouse and logistics firms they compete with for seasonal labor, started searching for temporary workers a month earlier than in recent years. This suggests retailers and other firms “anticipate stronger consumer demand and expect that it will be harder to find the people they want to hire,” said Indeed economist Jed Kolko.
Last year, more than one in four retail workers hired in the fourth quarter of 2015 started their jobs in October, the highest share on records back to the 1930s.
 Click on graph for larger image.
This graph really shows the collapse in retail hiring in 2008. Since then seasonal hiring has increased back close to more normal levels.
Note that retailers have been hiring earlier with more seasonal hires in October (red).
Based on the information in the WSJ article, it appears seasonal hiring will be at record levels in October this year.
Chicago Fed "Economic Growth Picked Up in September"
by Calculated Risk on 10/24/2016 08:37:00 AM
From the Chicago Fed: Economic Growth Picked Up in September
Led by improvements in production-related indicators, the Chicago Fed National Activity Index (CFNAI) increased to –0.14 in September from –0.72 in August. All four broad categories of indicators that make up the index increased from August, but in September, all four categories made negative contributions to the index for the second straight month.This graph shows the Chicago Fed National Activity Index (three month moving average) since 1967.
The index’s three-month moving average, CFNAI-MA3, edged down to –0.21 in September from –0.14 in August. September’s CFNAI-MA3 suggests that growth in national economic activity was somewhat below its historical trend. The economic growth reflected in this level of the CFNAI-MA3 suggests subdued inflationary pressure from economic activity over the coming year
emphasis added
 Click on graph for larger image.
This suggests economic activity was below the historical trend in September (using the three-month average).
According to the Chicago Fed:
What is the National Activity Index? The index is a weighted average of 85 indicators of national economic activity drawn from four broad categories of data: 1) production and income; 2) employment, unemployment, and hours; 3) personal consumption and housing; and 4) sales, orders, and inventories.
A zero value for the index indicates that the national economy is expanding at its historical trend rate of growth; negative values indicate below-average growth; and positive values indicate above-average growth.
Sunday, October 23, 2016
Sunday Night Futures
by Calculated Risk on 10/23/2016 08:24:00 PM
Weekend:
• Schedule for Week of Oct 23, 2016
Monday:
• At 8:30 AM ET, the Chicago Fed National Activity Index for September. This is a composite index of other data.
From CNBC: Pre-Market Data and Bloomberg futures: S&P futures and DOW futures are up slightly (fair value).
Oil prices were mixed over the last week with WTI futures at $50.67 per barrel and Brent at $51.61 per barrel. A year ago, WTI was at $44, and Brent was at $47 - so oil prices are UP about 10% to 15% year-over-year.
Here is a graph from Gasbuddy.com for nationwide gasoline prices. Nationally prices are at $2.21 per gallon (close to unchanged from a year ago). Gasoline prices will be up year-over-year soon.
Vehicle Sales Forecasts: Sales Over 17 Million SAAR Again in October
by Calculated Risk on 10/23/2016 12:41:00 PM
The automakers will report October vehicle sales on Tuesday, November 1st.
Note: There were 26 selling days in October 2016, down from 28 in October 2015.
From WardsAuto: Forecast: October Daily Sales to Reach 15-Year High
A WardsAuto forecast calls for October U.S. light-vehicle sales to reach a 17.8 million-unit seasonally adjusted annual rate, making it the seventh month this year to surpass 17 million.From J.D. Power: New-Vehicle Retail Sales in October Slip; Sixth Monthly Decline of 2016
A 17.8 million SAAR is greatly higher than the 17.3 million recorded year-to-date through September, but does not beat the 18.1 million result recorded in the same month last year.
emphasis added
The SAAR for total sales is projected at 17.7 million units in October 2016, down from 18.1 million units a year ago.This graph shows light vehicle sales since the BEA started keeping data in 1967.
The dashed line is the September sales rate.Sales for 2016 - through the first nine months - were up slightly from the comparable period last year.
After increasing significantly for several years following the financial crisis, auto sales are now mostly moving sideways.


