by Calculated Risk on 10/07/2016 09:55:00 AM
Friday, October 07, 2016
Employment Comments: Another Decent Report
The headline jobs number was decent. Private sector job growth was solidly above the consensus forecast (167,000 vs forecast of 144,000), however public employment declined by 11,000. Even though the unemployment rate ticked up to 5.0%, both the participation rate and employment-population ratio also increased. And wage growth is increasing (slowly).
Earlier: September Employment Report: 156,000 Jobs, 5.0% Unemployment Rate
Job growth has averaged 178,000 per month this year.
In September, the year-over-year change was 2.45 million jobs - a solid gain.
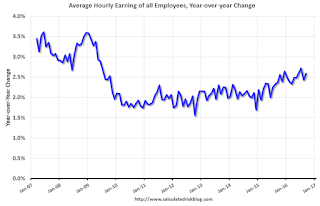
Average Hourly Earnings

The graph shows the nominal year-over-year change in "Average Hourly Earnings" for all private employees. Nominal wage growth was at 2.6% YoY in September. This series is noisy, however overall wage growth is trending up.
Note: CPI has been running around 2%, so there has been real wage growth.
Employment-Population Ratio, 25 to 54 years old

In the earlier period the participation rate for this group was trending up as women joined the labor force. Since the early '90s, the participation rate moved more sideways, with a downward drift starting around '00 - and with ups and downs related to the business cycle.
The 25 to 54 participation rate increased in September to 81.5%, and the 25 to 54 employment population ratio increased to 78.0%.
The participation rate has been trending down for this group since the late '90s, however, with more younger workers (and fewer older workers), the participation rate might move up some more.
Part Time for Economic Reasons

The number of persons employed part time for economic reasons (sometimes referred to as involuntary part-time workers) was little changed in September at 5.9 million. These individuals, who would have preferred full-time employment, were working part time because their hours had been cut back or because they were unable to find a full-time job.The number of persons working part time for economic reasons decreased in September. This level suggests slack still in the labor market.
These workers are included in the alternate measure of labor underutilization (U-6) that was unchanged at 9.7% in September.
Unemployed over 26 Weeks
 This graph shows the number of workers unemployed for 27 weeks or more.
 According to the BLS, there are 1.974 million workers who have been unemployed for more than 26 weeks and still want a job. This was down from 2.006 million in August.
This is generally trending down, but is still high.
There are still signs of slack (as example, elevated level of part time workers for economic reasons and U-6), but there also signs the labor market is tightening.
Overall this was another decent report.


