by Calculated Risk on 2/13/2017 10:11:00 AM
Monday, February 13, 2017
Hotels: Solid Start to 2017
From HotelNewsNow.com: STR: US hotel results for week ending 4 February
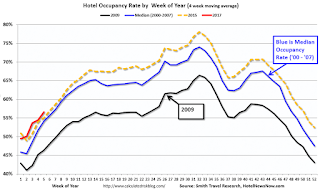
he U.S. hotel industry reported mostly negative results in the three key performance metrics during the week of 29 January through 4 February 2017, according to data from STR.The following graph shows the seasonal pattern for the hotel occupancy rate using the four week average.
In a year-over-year comparison with the week of 31 January through 6 February 2016:
• Occupancy: -1.5% to 55.6%
• Average daily rate (ADR): +0.2% to US$119.58
• Revenue per available room (RevPAR): -1.3% to US$66.51
emphasis added
 The red line is for 2017, dashed is 2015, blue is the median, and black is for 2009 - the worst year since the Great Depression for hotels.
2015 was the best year on record for hotels.
So far occupancy in 2017 is slightly ahead of 2015, and well ahead of the median rate.
For hotels, this is the slow season of the year, and occupancy will pick up into the Spring.
Data Source: STR, Courtesy of HotelNewsNow.com


