by Calculated Risk on 3/24/2017 04:22:00 PM
Friday, March 24, 2017
CoreLogic: "Between 2007–2016, Nearly 7.8 Million Homes Lost to Foreclosure"
Here is a report from CoreLogic: US Residential Foreclosure Crisis: 10 Years Later. There are several interesting graphs in the report, including foreclosures completed by year.
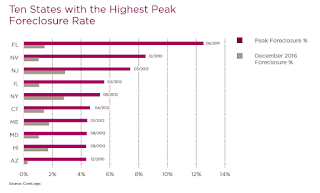
This graph for CoreLogic the Ten States with the highest peak foreclosure rate during the crisis, and the current foreclosure rate.

Here is a table based on data from the CoreLogic report showing completed foreclosure per year.
| Completed foreclosure by Year Source: CoreLogic | |
|---|---|
| Year | Completed Foreclosures |
| 2000 | 191,295 |
| 2001 | 183,437 |
| 2002 | 232,330 |
| 2003 | 255,010 |
| 2004 | 275,900 |
| 2005 | 293,541 |
| 2006 | 383,037 |
| 2007 | 592,622 |
| 2008 | 983,881 |
| 2009 | 1,035,033 |
| 2010 | 1,178,234 |
| 2011 | 958,957 |
| 2012 | 853,358 |
| 2013 | 679,923 |
| 2014 | 608,321 |
| 2015 | 506,609 |
| 2016 | 385,748 |


