by Calculated Risk on 3/16/2017 08:45:00 AM
Thursday, March 16, 2017
Housing Starts increased to 1.288 Million Annual Rate in February
From the Census Bureau: Permits, Starts and Completions
Housing Starts:
Privately-owned housing starts in February were at a seasonally adjusted annual rate of 1,288,000. This is 3.0 percent above the revised January estimate of 1,251,000 and is 6.2 percent above the February 2016 rate of 1,213,000. Single-family housing starts in February were at a rate of 872,000; this is 6.5 percent above the revised January figure of 819,000. The February rate for units in buildings with five units or more was 396,000.
Building Permits:
Privately-owned housing units authorized by building permits in February were at a seasonally adjusted annual rate of 1,213,000. This is 6.2 percent below the revised January rate of 1,293,000, but is 4.4 percent above the February 2016 rate of 1,162,000. Single-family authorizations in February were at a rate of 832,000; this is 3.1 percent above the revised January figure of 807,000. Authorizations of units in buildings with five units or more were at a rate of 334,000 in February.
emphasis added
 Click on graph for larger image.
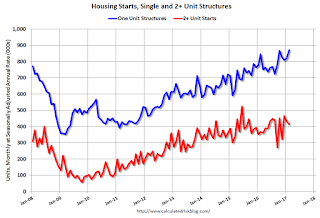
The first graph shows single and multi-family housing starts for the last several years.
Multi-family starts (red, 2+ units) decreased in February compared to January. Multi-family starts are up year-over-year.
Multi-family is volatile, and the swings have been huge over the last six months.
Single-family starts (blue) increased in February, and are up 3.2% year-over-year.
This is the highest level for single family starts since 2007.
 The second graph shows total and single unit starts since 1968.
 The second graph shows the huge collapse following the housing bubble, and then - after moving sideways for a couple of years - housing is now recovering (but still historically low),
Total housing starts in February were above expectations. December and January were revised slightly. Another solid report. I'll have more later ...


