by Calculated Risk on 6/30/2017 12:57:00 PM
Friday, June 30, 2017
U.S. Births decreased in 2016, Women 30-34 Now have Highest Birth Rate
From the National Center for Health Statistics: Births: Provisional Data for 2016. The NCHS reports:
The provisional number of births for the United States in 2016 was 3,941,109, down 1% from 2015. The general fertility rate was 62.0 births per 1,000 women aged 15–44, down 1% from 2015 to a record low for the United States. ...Here is a long term graph of annual U.S. births through 2016 ...
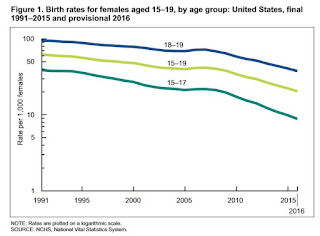
The provisional birth rates for teenagers aged 15–17 and 18–19 were 8.8 and 37.5 births per 1,000 women, respectively, down by 11% and 8% from 2015 and record lows for both groups.
...
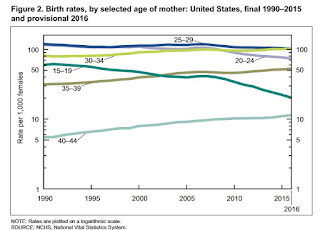
The provisional birth rate for women aged 20–24 was 73.7 births per 1,000 women in 2016, a decline of 4% from 2015 (76.8), reaching again another record low for this age group.
...
The rate for women aged 25–29 was 101.9 births per 1,000 women, down 2% from 2015 (104.3) and another record low for this age group.
...
The provisional birth rate for women aged 30–34 in 2016 was 102.6 births per 1,000 women, up 1% from 2015 (101.5) to the highest rate for this age group since 1964.
...
The provisional birth rate for women aged 40–44 in 2016 was 11.4 births per 1,000 women, up 4% from 2015 (11.0) to the highest rate for this age group since 1966.
 Click on graph for larger image.
Births have declined for two consecutive years following increases in 2013 and 2014.
A key trend is that women are waiting longer to have babies. Waiting longer to have children makes sense (see: Demographics and Behavior and U.S. Demographics: The Millennials Take Over) and we should expect a baby boom in a few years as the largest cohorts move into the 25 to 34 years old age groups.
I expect that as families have babies, they will tend to buy homes (as opposed to rent). The demographics are favorable for renting now, but the demographics will become more positive for homeownership.
 The second graph is from the NCHS report and shows birth rates by age group.
 From the NCHS:
The rate for women aged 25–29 was 101.9 births per 1,000 women, down 2% from 2015 (104.3) and another record low for this age group.Note that the highest birth rate is now for women in the 30 to 34 age group!
...
The provisional birth rate for women aged 30–34 in 2016 was 102.6 births per 1,000 women, up 1% from 2015 (101.5) to the highest rate for this age group since 1964.
 The third graph is from the NCHS report and shows births per 1,000 women by teen age group. From the NCHS:
 The provisional birth rates for teenagers aged 15–17 and 18–19 were 8.8 and 37.5 births per 1,000 women, respectively, down by 11% and 8% from 2015 and record lows for both groups.Far fewer teens births is great news (and is probably related to the much higher enrollment rates).


