by Calculated Risk on 10/06/2017 08:46:00 AM
Friday, October 06, 2017
September Employment Report: 33,000 Jobs Lost, 4.2% Unemployment Rate
From the BLS:
The unemployment rate declined to 4.2 percent in September, and total nonfarm payroll employment changed little (-33,000), the U.S. Bureau of Labor Statistics reported today. A sharp employment decline in food services and drinking places and below-trend growth in some other industries likely reflected the impact of Hurricanes Irma and Harvey.
...
Hurricane Irma made landfall in Florida on September 10--during the reference period for both the establishment and household surveys--causing severe damage in Florida and other parts of the Southeast. Hurricane Harvey made landfall in Texas on August 25--prior to the September reference periods--resulting in severe damage in Texas and other areas of the Gulf Coast.
Our analysis suggests that the net effect of these hurricanes was to reduce the estimate of total nonfarm payroll employment for September. There was no discernible effect on thenational unemployment rate.
...
The change in total nonfarm payroll employment for July was revised down from +189,000 to +138,000, and the change for August was revised up from +156,000 to +169,000. With these revisions, employment gains in July and August combined were 38,000 less than previously reported.
...
In September, average hourly earnings for all employees on private nonfarm payrolls rose by 12 cents to $26.55. Over the past 12 months, average hourly earnings have increased by 74 cents, or 2.9 percent.
emphasis added
 Click on graph for larger image.
The first graph shows the monthly change in payroll jobs, ex-Census (meaning the impact of the decennial Census temporary hires and layoffs is removed - mostly in 2010 - to show the underlying payroll changes).
Total payrolls decreased by 33 thousand in September (private payrolls decreased 40 thousand).
Payrolls for July and August were revised down by a combined 38 thousand.
 This graph shows the year-over-year change in total non-farm employment since 1968.
In September the year-over-year change was 1.78 million jobs. This is the smallest year-over-year gain since 2012.
The third graph shows the employment population ratio and the participation rate.
 The Labor Force Participation Rate was increased in September at 63.1%. This is the percentage of the working age population in the labor force. A large portion of the recent decline in the participation rate is due to demographics.
 The Employment-Population ratio decreased to 60.4% (black line).
I'll post the 25 to 54 age group employment-population ratio graph later.
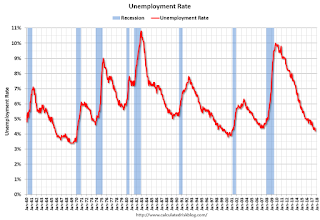
 The fourth graph shows the unemployment rate.
 The unemployment rate decreased in September to 4.2%.
This was below expectations of 95,000 jobs, and the previous two months combined were revised down. The headline jobs number was weak - mostly due to the impact of the hurricanes - but wages picked up and the unemployment rate declined further.
I'll have much more later ...


