by Calculated Risk on 1/10/2018 12:18:00 PM
Wednesday, January 10, 2018
U.S. Heavy Truck Sales up Year-over-year in 2017
Heavy truck sales increased 3% in 2017 compared to 2016, and heavy truck sales were up 18% year-over-year in December.
First, here is a table of heavy truck sales since 2000 (source: BEA).
Note that sales peaked during the housing bubble, and really collapsed during the great recession. The decline in 2016 was probably related to oil prices.
| Heavy Truck Sales (000s) | |
|---|---|
| Year | Sales |
| 2000 | 461.9 |
| 2001 | 350.1 |
| 2002 | 322.4 |
| 2003 | 328.4 |
| 2004 | 431.6 |
| 2005 | 496.5 |
| 2006 | 544.4 |
| 2007 | 371.1 |
| 2008 | 298.5 |
| 2009 | 199.8 |
| 2010 | 217.6 |
| 2011 | 306.6 |
| 2012 | 346.3 |
| 2013 | 352.6 |
| 2014 | 407.7 |
| 2015 | 449.3 |
| 2016 | 401.0 |
| 2017 | 412.5 |

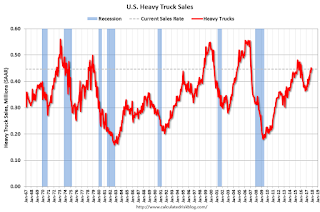
Click on graph for larger image.
This graph shows heavy truck sales since 1967 using data from the BEA. The dashed line is the December 2017 seasonally adjusted annual sales rate (SAAR).
Heavy truck sales really collapsed during the great recession, falling to a low of 181 thousand in April and May 2009, on a seasonally adjusted annual rate basis (SAAR).
Truck sales softened with the decline in oil prices, however with the increase in oil prices over the last year, heavy truck sales increased too.
Heavy truck sales were at 447 thousand SAAR in December 2017, down slightly from 451 thousand in November, and up from 379 thousand in December 2016. With solid construction and rising oil prices, heavy truck sales will probably increase in 2018.


