by Calculated Risk on 2/23/2018 12:05:00 PM
Friday, February 23, 2018
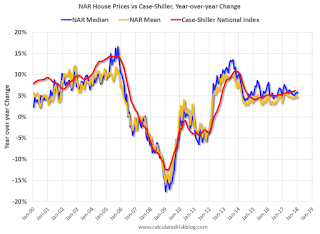
House Prices: NAR Median Prices vs Case-Shiller Index
During the housing bubble and subsequent bust, I noted that the median house price could be distorted by the mix of houses sold. I preferred to use the repeat sales indexes from the FHFA, Case-Shiller and Corelogic (and others).
Now that most of the distortion from the bubble is behind us, I thought I'd take a look at the median (and mean) house price data for existing home sales from the NAR, compared to the Case-Shiller National index.
The first graph show the NAR existing home sales median and mean prices since 1999 (Not Seasonally Adjusted), compared to Case-Shiller (Seasonally Adjusted).

The median and mean house prices showed less of an increase in prices during the bubble (this was the distortion I discussed back in 2005 and 2006).
Now it appears the median and mean prices are pretty much tracking the Case-Shiller index.
The second graph show the same data on a year-over-year basis.

The Case-Shiller National Index was up 6.2% in November.
The NAR median price was up 5.8% in January, and the mean price was up 4.7%.
I still prefer the repeat sales indexes, but I think the NAR prices are also useful.
The third graph shows the NAR existing home median prices, the Census Bureau's new home median prices, and the Case-Shiller national index.

Compared to the bubble peak, the NAR median price is up 4.4%, the Case-Shiller index is up 6.4%, however new home median prices are up 27.5%!


