by Calculated Risk on 6/08/2018 11:19:00 AM
Friday, June 08, 2018
AAR: Rail Carloads Up 3.2% YoY, Intermodal Up 6.6% YoY
From the Association of American Railroads (AAR) Rail Time Indicators. Graphs and excerpts reprinted with permission.
The U.S. economy is clicking right now, and freight railroads are both beneficiaries and enablers of that. In May 2018, originated carloads on U.S. railroads were up 3.2% over May 2017, the third straight month with year-over-year growth greater than 3%. In May 2018, 15 of the 20 commodity categories the AAR tracks saw higher carloads, including nearly all the major categories. Total carloads averaged 263,884 in May 2018, the most for May since 2015. … May was a good month for intermodal too: U.S. intermodal originations in May 2018 were up 6.6% over last year.
 Click on graph for larger image.
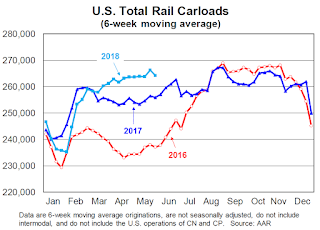
This graph from the Rail Time Indicators report shows U.S. average weekly rail carloads (NSA). Light blue is 2018.
Rail carloads have been weak over the last decade due to the decline in coal shipments.
U.S. railroads originated 1,319,420 carloads in May 2018, up 3.2% (41,078 carloads) over May 2017. Year-over-year carloads have risen by more than 3% for three straight months. Carloads averaged 263,884 in May 2018, the most for May since 2015. Year-to-date carloads through May (5.67 million) were up 1.2%, or 66,071 carloads, over the first five months of last year and were up 8.1% (422,829 carloads) over the first five months of 2016.
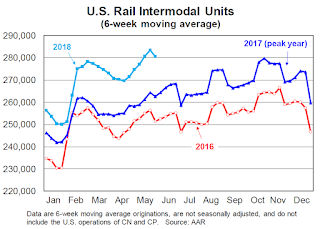
 The second graph is for intermodal traffic (using intermodal or shipping containers):
U.S. railroads originated 1,398,203 intermodal containers and trailers in May 2018, up 6.6%, or 86,010 units, over May 2017. Average weekly intermodal volume in May 2018 was 279,641 units — that’s the second most in history. (Only February 2018, at 279,853, had more.)
Year-to-date intermodal volume through May was a record 5,993,584, up 6.0%, or 336,944 units, over the same period in 2017. Barring a catastrophe, this year will be another record year for U.S. intermodal.


