by Calculated Risk on 12/19/2018 11:19:00 AM
Wednesday, December 19, 2018
Comments on November Existing Home Sales
Earlier: NAR: Existing-Home Sales Increased to 5.32 million in November
Two key points:
1) The key for the housing - and the overall economy - is new home sales, single family housing starts and overall residential investment. Overall this is a reasonable level for existing home sales, and the recent weakness is no surprise given the increase in mortgage rates.
2) Inventory is still low, but was up 4.2% year-over-year (YoY) in November. This was the fourth consecutive month with a year-over-year increase in inventory, and the largest YoY increase since late 2014.

The current slight YoY increase in inventory is nothing like what happened in 2005 and 2006. In 2005 (see red arrow), inventory kept increasing all year, and that was a sign the bubble was ending.
Although I expected inventory to increase YoY in 2018, I also expected inventory to follow the normal seasonal pattern (not keep increasing all year).
Also inventory levels remains low, and could increase much more and still be at normal levels. No worries.

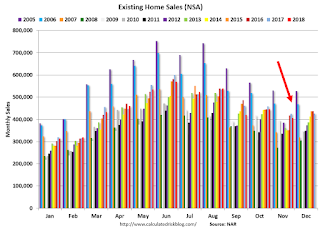
Sales NSA in November (406,000, red column) were below sales in November 2017 (425,000, NSA), but were the third highest since the housing bubble (behind 2016 and 2017).
Sales NSA through November (first eleven months) are down about 2.3% from the same period in 2017.
This is a small YoY decline in sales to-date - it is likely that higher mortgage rates are impacting sales, and it is possible there has been an impact from the changes to the tax law (decreasing property taxes write-off, etc).


