by Calculated Risk on 3/17/2020 10:06:00 AM
Tuesday, March 17, 2020
NAHB: Builder Confidence Decreased to 72 in March
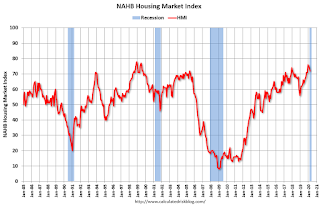
The National Association of Home Builders (NAHB) reported the housing market index (HMI) was at 72, down from 74 in February. Any number above 50 indicates that more builders view sales conditions as good than poor.
From NAHB: Builder Confidence Declines But Remains Solid Amid Rising Risks
Builder confidence in the market for newly-built single-family homes fell two points to 72 in March, according to the latest NAHB/Wells Fargo Housing Market Index (HMI) released today. Sentiment levels have held in a firm range in the low- to mid-70s for the past six months.
“Builder confidence remains solid, although sales expectations for the next six months dropped four points on economic uncertainty stemming from the coronavirus,” said NAHB Chairman Dean Mon. “Interest rates remain low, and a lack of inventory creates market opportunities for single-family builders.”
“It is important to note that half of the builder responses in the March HMI were collected prior to March 4, so the recent stock market declines and the rising economic impact of the coronavirus will be reflected more in next month’s report,” said NAHB Chief Economist Robert Dietz. “Overall, 21% of builders in the survey report some disruption in supply due to virus concerns in other countries such as China. However, the incidence is higher (33%) among builders who responded to the survey after March 6, indicating that this is an emerging issue.”
...
The HMI index gauging current sales conditions fell two points to 79, the component measuring sales expectations in the next six months dropped four points to 75 and the gauge charting traffic of prospective buyers also decreased one point to 56.
Looking at the three-month moving averages for regional HMI scores, the Midwest fell two points to 66, the South moved one point lower to 77 and the West posted a one-point decline to 82. The Northeast rose two points to 64.
emphasis added
 Click on graph for larger image.
This graph show the NAHB index since Jan 1985.
This was slightly below the consensus forecast, but still another very strong reading. However, this survey was largely prior to the impact of COVID-19.
Note: The graph shows the 2020 recession starting in March 2020.


