by Calculated Risk on 5/07/2020 11:16:00 AM
Thursday, May 07, 2020
Hotels: Occupancy Rate Declined 58.5% Year-over-year, Slight Increase Week-over-week
From HotelNewsNow.com: STR: US hotel results for week ending 2 May
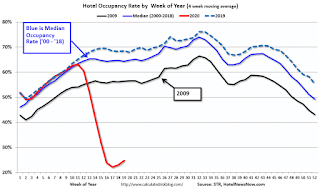
STR data for 26 April through 2 May 2020 showed slightly higher U.S. hotel occupancy compared with previous weeks, but the same significant level of year-over-year decline in the three key performance metrics.The following graph shows the seasonal pattern for the hotel occupancy rate using the four week average.
In comparison with the week of 28 April through 4 May 2019, the industry recorded the following:
• Occupancy: -58.5% to 28.6%
• Average daily rate (ADR): -44.0% to US$74.72
• Revenue per available room (RevPAR): -76.8% to US$21.39
“Week-to-week comparisons showed a third consecutive increase in room demand, which provides further hope that early-April was the performance bottom,” said Jan Freitag, STR’s senior VP of lodging insights. “TSA checkpoint numbers, up for the second week in a row, aligned with this rise in hotel guest activity, which still remains incredibly low in the big picture. Overall, these last few weeks can be filed under the ‘less bad’ category.
“At the same time, this past week was the first to show solid evidence of leisure demand as weekend occupancy grew in states that have significantly eased mitigation efforts. As we have noted throughout the pandemic, the leisure segment will be the first to show a demand bounce back. In weeks prior, the more reasonable conclusion was that hotels were selling mostly to essential worker types.”
emphasis added
 Click on graph for larger image.
The red line is for 2020, dash light blue is 2019, blue is the median, and black is for 2009 (the worst year probably since the Great Depression for hotels).
2020 was off to a solid start, however, COVID-19 has crushed hotel occupancy.
Note: Y-axis doesn't start at zero to better show the seasonal change.


